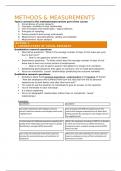
METHODS AND MEASUREMENT
Methods: teach you how to design a study that can answer your research question.
measurement: teach you how to measure social and psychological constructs.
Statistics: teach you how to describe and analyze your data and test hypotheses.
Introduction to statistics (1)
Who use “statistics” to:
Describe/summarize data: Descriptive statistics.
• Reduce the date to understandable pieces of information. Describe/summarize data.
• Example: what proportion of Dutch adults has a driver’s license?
• Example: what is the aerage delay across all train travels in the Netherlands today?
Drawing inferences about populations: Inferential statistics
• In science we often want to draw conclusions about populations. Drawing inferences
about populations.
• Example: are COVID-19 vaccines safe and effective in the general population?
• Problem: we can often only make observations on a selction of cases from a
population.
• Solution: we can inferential statistics to find out if the sample results can be
generalized to the population.
Studying complex multivariate relationships: Statistical modeling:
• In research we are often interested in relationships between several variables.
• People differ in their scores on those variables. Science aims to explain as much of
these differences.
• Example: to what extent does years of education predict healthy lifestyle, controlled
for income differences?
• Statistical modeling can help to uncover such complex relations.
studying complex multivariate relationships.
Lecture overview:
• Part I: measurement levels
- Important characteristic of variables in your data
• Part II: Data inspection
- Graphs
- Statistics
Measurement levels:
In the social sciences we often collect quantitative date using questionnaires.
Example: measurement of participant age, socio-economic status, attitudes, ect.
We make a basic distinction between four types of date:
• nominal
• Ordinal
• interval
• Ratio
,They differ in how refined or exact the measurement is:
• Nominal is the lowest and ratio the highest level.
• Measuring at a lower level is often easier but less informative.
Nominal measurement level:
• Numbers express different unordered categories or groups.
• Example: marital status:
1 = single
2 = married
3 = in a relationship but not married
4 = it’s complicated
4 = not specified otherwise.
• Nominal variables classifies cases into two or more categories. Categories must be
exhaustive (all possibilities should be covered) and mutually exclusive (i. e., every
case fits one category and one category only).
Ordinal measurement level:
• Number express different ordered categories (less/more).
• Example:
1 = never.
2 = at least 1 cigarette per month, but less than 1 cigarette per day.
3 = at least 1 cigarette per day, but less than 5 cigarettes per day.
4 = 5 or more cigarettes per day.
• Ordinal variables express more or less of a quantity but the difference between pairs
of categories is not necessarily the same quantity.
• There should be a logical order,
- not logical: Never -> occasionally -> daily -> often.
Interval measurement level:
• Number express differences in quantity using a common unit with equal intervals
between the neighboring date points, but no true zero point.
• Example: IQ test score,
- the difference between 70 and 80 IQ points is comparable to a difference
between 100 and 110. Both span a difference of 10 units.
• Example: temperature,
- If on Monday the temperature is 30 degrees, on Tuesday 25 degrees, and
Wednesday, 15 degrees, then we can say that the temperature drop between
Tuesday and Wednesday is twice as large as the drop between Monday and
Tuesday.
- Zero point is arbitrary: zero Fahrenheit ≠ zero Celsius.
Ratio measurement level:
• Numbers express differences in quantity on a common unit and have natural zero
points.
• Example: Length, weight or income.
- A length, weight, or income of 0 can be meaningfully interpreted.
, - This allows for relative comparisons: if Peter’s monthly income is 5000 euros and
John’s is 50 euros, then Peter’s income is 100 times higher than John’s income.
- The black butterfly is twice as tall as the white butterfly.
• Such comparisons are not possible on interal level:
- 6 degrees is not twice as hot as 3 degrees.
- Someone with an IQ of 120 is not twice as smart as someone with an IQ of 60.
Measurement levels:
• Both interval and ratio-level date are referred to as scale date. The idea is simple: All
variables that are not nominal or ordinal are treated as scale-level variables. SPSS
distinguishes between nominal, ordinal and scale.
• It’s a property of the measurement values, it is not. An intrinsic property of the thing
you are measuring.
• Example: you cannot say that “intelligence” has interval level; Intelligence can be
measured at different levels depending on the measurement instrument
- Nominal: variable indicating someone’s intelligence type
- Ordinal: variable indicating the highest completed education
- Interval: score resulting of an IQ test.
- Ratio: skull circumference
, Measurement level and statistical analysis
• Measurement levels determine the kind of statistics and statistical analyses you can
use meaningfully.
- Example: the mean of a nominal variable is meaningless.
- Hence for the analyses you should always respect the measurement levels of the
variables you will use you will use in statistical analyses.
• Many of the commonly used statistical techniques assume scale data.
- Problem: it is often not evident that variables have an interval level.
- Example: attitude towards a governmental policy on a scale ranging from
1 (= completely against) to 7 (= completely in favor)
- Therefore, it is common practice to simply assume that we have acquired interval
data, without worrying too much if this is really true.
Data inspection:
• Every analysis starts with date inspection (getting to know your date): its goal is to get
a clear picture of the data by examining one variable at the time (univariate), or pairs
of variables (bivariate).
In general, we want to inspect:
• central tendency: what are the most common values?
• Variabillity: how large are the differences between the subjects? are there extreme
values in the sample?
• Biavariate association: for each pair of variables, do they associate/covary/correlate
(do low/large values on variable A go together with low/large values on variable B).