Lecture 1 methods
Book, chapters: 2, 3, 5, 8, 9, and 4 (selected pages) and 15 on elaboration: tables and
beyond. Social research, approached and fundamentals. (Lecture sheets cover the main
topics: read the chapters with focus on sections that can be linked to topics introduced in the
lectures)
Topics:
- Cornerstones of social research
- Concepts, variables and their relationship
- Unit of analysis and nested data – logical fallacies
- Principles of sampling
- Survey research and survey instruments
- Measurement: operationalizing, validity and reliability
Lecture 1: cornerstones of social research, concepts – variables and their relationship
1. Cornerstones of social research (Chapter 2)
Defining research questions: quantitative and qualitative
a) Quantitative research questions:
Descriptive questions: “What is the average number of days
of sick leave per year due to burn-out?”
- Explanatory questions: “To what extent does the average
number of days of sick leave due to burn-out differ across
sectors of employment?”
Focus on nomothetic ‘causal’ relationships (‘predicting’ the
outcome variable)
-> establishing generalizations that apply to everyone [<-> idiographic
‘causal’ relationship]
b) Qualitative research questions
- Questions about lied personal experience, understanding and meaning of stories:
How do employees who suffered from burn-out last year link this to personal
experiences at work before and after their burn-out?
Focuses on ideographic relationships (rather than on nomethetic ‘causal relationships).
c) Comparing research questions
Quantitative (kwantitatief) Qualitative (kwalitatief)
Do positive experiences with refugees How do people with different experiences in
increase a person’s tolerance towards a new their contact with refugees understand how
refugee centre in the neighborhood? it affects their feelings towards the opening
of a new refugee centre in the
neighborhood?
To what extent do childhood experiences What is the experience of outing as LGBTQ
regarding the quality of the relationship of in a situation in which one is the first to out
parents impact on gender identification within the family as compared to when a
amongst LGBTQ community? relative already outed as LGBTQ before one
did?
, Does autocratic leadership of the direct What does autocratic leadership of a direct
supervisor decrease the work performance supervisor mean to employees in terms of
and motivation of employees? their motivation and performance at work?
Quantitative one thing leads to something else.
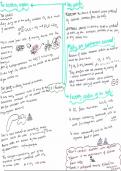
Theory(-ies) <- propositions -> hypotheses
- Proposition:
- Example: “When an individual manages a particular task well, then (s)he will perform
that task better in the presence of others than when nobody else is present”
(= social facilitation effect SFE)
proposition: = general statement regarding a regularity in the behavior or opinion of
subjects.
(Something you know before the research, it links theories and hypotheses). You need to
make it observable.
The question is: why is this the case?
➔ Theory = provides an explanation for a proposition or set of propositions ≠
speculation!
Ex: alternative theories fort he SFE proposition: biological versus psychological
‘explanation’.
- ‘Biological’: the presence of others activates physiological triggers.
- ‘Psychological’: people perform better when they believe they are being watched/
evaluated.
= Nature versus nature debate in many social and behavioral sciences.
Next question: how can we research that?
= Applying it in a concrete situation. E.g: athletics.
➔ Hypotheses = athletes will perform better:
(a) The more spectators there are;
(b) The more journalists there are that will comment on their performances;
(c) When there is direct coverage of the event by the media (television, …)
Science as a process: induction – deduction
,Inductively induced research project – example
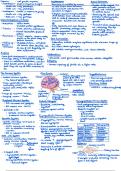
Johan Denollet’s “D-personality”
- He was working as a psychologist at the cardiac rehabilitation unit of
the Antwerp University Hospital when he observed that different
patients had different chances of rehabilitation that seems to be linked
to personality characteristics.
- He then developed a method that allowed measuring two aspects of
personality (‘negative affectivity’ (NA) and ‘social inhibition’(SI)) and
found that when patients combined both these patients had less
chance of rehabilitation.
- He then developed his theory on the D-type personality (D = distress =
combining NA + SI) arguing that this broad and stable personality trait
is a clear risk factor of cardiac events in the future.
Deductively induced research project – example
Peter M. Blau and Otis D. Duncan:
- Developed the status attainment model in the 1960’s to explain social
mobility patterns in societies.
- The overarching research question was: what attributes facilitate the
movement of individuals into occupations with particular (desirable) social
status?
- They argued that occupational outcomes are shaped by family of origin
in a direct and indirect way. A typical model is as follows:
Concepts, variables and their relationship (chaptor 3 = this one is important)
Concepts (or constructs) = general/abstract description of a social phenomena e.g.
ethnocentrism.
Variable = empirical manifestation of a concept e.g. a scale that measures ethnocentrism.
Hypotheses = an expected relationship between 2 or more variables that can be
researched/tested e.g. women are on average less ethnocentric than men.
The way question is the theory question. Theory: is explaining why.
If you can observe it’s a hypothesis. Proposition is in the middle. It’s very wide, it does not
apply why of observing. It’s not directly observing. We test the hypothesis. Hypotheses is a
mix of concepts and variables.
Induction and deduction
Induction starts with observations. To some observations to generalizations.
Deduction starts with hypotheses.
Types of hypotheses (chapter 3 + pages 463-470)
Bivariate hypothesis: expected relationship between two variables (=total effect)
Diagram:
X Y
XY
legend: X = independent variable (‘cause’) - Y = dependent variables (‘outcome’)
= direction of effect (from independent on dependent).
, Example: “The higher the emotional intelligence of a person, the higher the amount of
money a person gives to good causes.”
➔ Wording reflects metric measurement (scale)
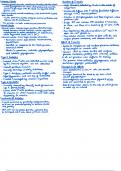
Intermezzo: measurement levels of variables (see also statistics part of the course).
Intermezzo: measurement levels of variables
A. Categorical
A1. Nominal -> classifying cases in distinct nominal classes; order of classes has no
meaning ex. Religious denomination
A2. Ordinal -> nominal classification + order of classes is flixed (and can only be reversed)
ex. To what extent do you agree or disagree with the following statement? …
Completely disagree – disagree – agree – completely agree
B. Metric
B1. Interval -> ordered + numbered with meaningful interpretation of distance between
scores.
Ex. Year in which a person first visited a museum.
Ann: 2008 and Phil: 2010 -> two years difference
B2. Ratio -> interval + ratio is meaningful
Ex. How much does a person earn in € per.
Examples: “The higher the emotional intelligence of a person, the higher the amount of
money a person gives to good causes.”
➔ Wording both variables reflects metric measurement
“The higher the emotional intelligence of a person the higher the chance people become
Foster parent”.
➔ Dependent = categorical (nonmetric); independent = metric
“Women have on average a higher level op emotional intelligence then men.”
➔ Independent = categorical (non-metric);
Dependent = metric
!Distinction between metric versus non-metric refers to ‘measurement level’s of variable.
! making the distinction is vital to statistics.
! Formulation of hypothesis should be consistent with the distinction.
! Applies to all types of hypotheses.
multi variables: more than 2.
Book, chapters: 2, 3, 5, 8, 9, and 4 (selected pages) and 15 on elaboration: tables and
beyond. Social research, approached and fundamentals. (Lecture sheets cover the main
topics: read the chapters with focus on sections that can be linked to topics introduced in the
lectures)
Topics:
- Cornerstones of social research
- Concepts, variables and their relationship
- Unit of analysis and nested data – logical fallacies
- Principles of sampling
- Survey research and survey instruments
- Measurement: operationalizing, validity and reliability
Lecture 1: cornerstones of social research, concepts – variables and their relationship
1. Cornerstones of social research (Chapter 2)
Defining research questions: quantitative and qualitative
a) Quantitative research questions:
Descriptive questions: “What is the average number of days
of sick leave per year due to burn-out?”
- Explanatory questions: “To what extent does the average
number of days of sick leave due to burn-out differ across
sectors of employment?”
Focus on nomothetic ‘causal’ relationships (‘predicting’ the
outcome variable)
-> establishing generalizations that apply to everyone [<-> idiographic
‘causal’ relationship]
b) Qualitative research questions
- Questions about lied personal experience, understanding and meaning of stories:
How do employees who suffered from burn-out last year link this to personal
experiences at work before and after their burn-out?
Focuses on ideographic relationships (rather than on nomethetic ‘causal relationships).
c) Comparing research questions
Quantitative (kwantitatief) Qualitative (kwalitatief)
Do positive experiences with refugees How do people with different experiences in
increase a person’s tolerance towards a new their contact with refugees understand how
refugee centre in the neighborhood? it affects their feelings towards the opening
of a new refugee centre in the
neighborhood?
To what extent do childhood experiences What is the experience of outing as LGBTQ
regarding the quality of the relationship of in a situation in which one is the first to out
parents impact on gender identification within the family as compared to when a
amongst LGBTQ community? relative already outed as LGBTQ before one
did?
, Does autocratic leadership of the direct What does autocratic leadership of a direct
supervisor decrease the work performance supervisor mean to employees in terms of
and motivation of employees? their motivation and performance at work?
Quantitative one thing leads to something else.
Theory(-ies) <- propositions -> hypotheses
- Proposition:
- Example: “When an individual manages a particular task well, then (s)he will perform
that task better in the presence of others than when nobody else is present”
(= social facilitation effect SFE)
proposition: = general statement regarding a regularity in the behavior or opinion of
subjects.
(Something you know before the research, it links theories and hypotheses). You need to
make it observable.
The question is: why is this the case?
➔ Theory = provides an explanation for a proposition or set of propositions ≠
speculation!
Ex: alternative theories fort he SFE proposition: biological versus psychological
‘explanation’.
- ‘Biological’: the presence of others activates physiological triggers.
- ‘Psychological’: people perform better when they believe they are being watched/
evaluated.
= Nature versus nature debate in many social and behavioral sciences.
Next question: how can we research that?
= Applying it in a concrete situation. E.g: athletics.
➔ Hypotheses = athletes will perform better:
(a) The more spectators there are;
(b) The more journalists there are that will comment on their performances;
(c) When there is direct coverage of the event by the media (television, …)
Science as a process: induction – deduction
,Inductively induced research project – example
Johan Denollet’s “D-personality”
- He was working as a psychologist at the cardiac rehabilitation unit of
the Antwerp University Hospital when he observed that different
patients had different chances of rehabilitation that seems to be linked
to personality characteristics.
- He then developed a method that allowed measuring two aspects of
personality (‘negative affectivity’ (NA) and ‘social inhibition’(SI)) and
found that when patients combined both these patients had less
chance of rehabilitation.
- He then developed his theory on the D-type personality (D = distress =
combining NA + SI) arguing that this broad and stable personality trait
is a clear risk factor of cardiac events in the future.
Deductively induced research project – example
Peter M. Blau and Otis D. Duncan:
- Developed the status attainment model in the 1960’s to explain social
mobility patterns in societies.
- The overarching research question was: what attributes facilitate the
movement of individuals into occupations with particular (desirable) social
status?
- They argued that occupational outcomes are shaped by family of origin
in a direct and indirect way. A typical model is as follows:
Concepts, variables and their relationship (chaptor 3 = this one is important)
Concepts (or constructs) = general/abstract description of a social phenomena e.g.
ethnocentrism.
Variable = empirical manifestation of a concept e.g. a scale that measures ethnocentrism.
Hypotheses = an expected relationship between 2 or more variables that can be
researched/tested e.g. women are on average less ethnocentric than men.
The way question is the theory question. Theory: is explaining why.
If you can observe it’s a hypothesis. Proposition is in the middle. It’s very wide, it does not
apply why of observing. It’s not directly observing. We test the hypothesis. Hypotheses is a
mix of concepts and variables.
Induction and deduction
Induction starts with observations. To some observations to generalizations.
Deduction starts with hypotheses.
Types of hypotheses (chapter 3 + pages 463-470)
Bivariate hypothesis: expected relationship between two variables (=total effect)
Diagram:
X Y
XY
legend: X = independent variable (‘cause’) - Y = dependent variables (‘outcome’)
= direction of effect (from independent on dependent).
, Example: “The higher the emotional intelligence of a person, the higher the amount of
money a person gives to good causes.”
➔ Wording reflects metric measurement (scale)
Intermezzo: measurement levels of variables (see also statistics part of the course).
Intermezzo: measurement levels of variables
A. Categorical
A1. Nominal -> classifying cases in distinct nominal classes; order of classes has no
meaning ex. Religious denomination
A2. Ordinal -> nominal classification + order of classes is flixed (and can only be reversed)
ex. To what extent do you agree or disagree with the following statement? …
Completely disagree – disagree – agree – completely agree
B. Metric
B1. Interval -> ordered + numbered with meaningful interpretation of distance between
scores.
Ex. Year in which a person first visited a museum.
Ann: 2008 and Phil: 2010 -> two years difference
B2. Ratio -> interval + ratio is meaningful
Ex. How much does a person earn in € per.
Examples: “The higher the emotional intelligence of a person, the higher the amount of
money a person gives to good causes.”
➔ Wording both variables reflects metric measurement
“The higher the emotional intelligence of a person the higher the chance people become
Foster parent”.
➔ Dependent = categorical (nonmetric); independent = metric
“Women have on average a higher level op emotional intelligence then men.”
➔ Independent = categorical (non-metric);
Dependent = metric
!Distinction between metric versus non-metric refers to ‘measurement level’s of variable.
! making the distinction is vital to statistics.
! Formulation of hypothesis should be consistent with the distinction.
! Applies to all types of hypotheses.
multi variables: more than 2.