Methodology 3
Lecture summary
,Week 1:
Lecture 1 Introduction and null hypothesis
Example – Alcohol and driving performance
What do you want to know and what kind of research can answer your question?
- What is the incidence of drink-driving?
o Descriptive research
- Is there a relationship between alcohol dose and driving performance?
o Relational research
- Does alcohol dose influence driving performance?
o Experimental research
In psychology the most commonly used type of research is relational research. Most of the time you
are not able to use descriptive research, because not all data about your target group is available and
known. Experimental research gives the most information about the influence of one variable on
another, but is not ethically justified (most of these experiments are not humane, but can be done
with laboratory animals).
When doing relational research with two measurements per participant one can compose a scatter
plot. In a scatter plot each data point is composed out of two measures of a single participant.
Together all these points show a relationship between the measurements. With a scatter plot you
can find the correlation coefficient (r), which shows the strength of a linear relationship. This strength
represents correlation and NOT causation (think about the example with the amount of ice cream
sold and the amount of people drowning on a certain day).
When doing experimental research the researcher composes a hypothesis that specifies a causal
relationship. To test this hypothesis they must perform an experiment. In this experiment the
researcher manipulates (an) independent variable(s), controls the other variables by either keeping
them constant, through randomization, or by counterbalancing for the variable, and measures the
effect of the independent variable(s) on the dependent variable(s).
An experiment has a high internal validity if there are no confounds (variables that co-vary with the
independent variable). So, the independent variable must be the cause of the effect on the
dependent variable. The experiment then provides an insight in the causal relationship between
independent variable(s) and the dependent variable.
How do you assign participants to experimental conditions?
- Between subjects design
o There are independent groups of participants for each condition
o Participants are randomly assigned to groups
- Within subject design
o Each participant contributes to each condition
o There is a random assignment to the order of the conditions
The problem with inferential statistics is that we can never be sure that an observed effect in the
sample also exists in the population, the finding can always be just a coincidence.
, The general idea in inferential statistics is that you start with a null hypothesis that states that the
effect you’re researching does not exist in the population. If the observed data are very unlikely given
the null hypothesis, we reject the null hypothesis (there is probably an effect). This is the classical
approach also called null hypothesis significance testing (NHST).
For most experiments in psychology we use a p-value of .05 because we do not reject the null
hypothesis too readily if it is true, but there still is a fair chance to reject the null hypothesis if it is not
true.
The p-value is the probability of a certain outcome or a more extreme outcome, given the null
hypothesis.
Given that the null hypothesis is true, the more extreme the found value is, the less likely it is. And
the bigger the sample, the lower the likelihood of extreme outcomes.
The general steps of inferential statistics are:
1. Formulate the hypotheses (H0 and Ha)
2. Choose an appropriate test statistic
3. Determine the sampling distribution of the test statistic given the null hypothesis; determine
corresponding critical values and rejection area
4. Collect data and determine value test statistic
5. Relate the obtained value to the sampling distribution and determine whether the result is
significant or not
When your alternative hypothesis is nondirectional you test two-sides, the rejection area is
distributed between both ends of the distribution. If you suspect, prior to data collection, that the
result goes one way you make the alternative hypothesis directional and test one-sided. The
rejection are is on one side of the distribution.
You can calculate the probability of the value found in the data given the null hypothesis, but you can
never calculate the probability of the null hypothesis given the value found in the data.
Lecture 2: Chapter 6 and 7
The mean (m or µ) is a measure of central tendency. The mean is calculated by the sum of all
observations divided by the number of observations.
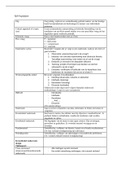
The variance (var) and the standard deviation (sd or σ) are measures of spread or dispersion. The
variance is calculated by dividing the sum of squares by the number of observations minus 1. The
standard deviation is the square root of the variance. The variance and the standard deviation can be
calculated with the formulas:
Sample statistics are random variables, they vary from sample to sample, and are written as Latin
letters. Population statistics are parameters, they have fixed and unknown values, and are written as
Greek letters. We use sample statistics to estimate the population statistics.
Lecture summary
,Week 1:
Lecture 1 Introduction and null hypothesis
Example – Alcohol and driving performance
What do you want to know and what kind of research can answer your question?
- What is the incidence of drink-driving?
o Descriptive research
- Is there a relationship between alcohol dose and driving performance?
o Relational research
- Does alcohol dose influence driving performance?
o Experimental research
In psychology the most commonly used type of research is relational research. Most of the time you
are not able to use descriptive research, because not all data about your target group is available and
known. Experimental research gives the most information about the influence of one variable on
another, but is not ethically justified (most of these experiments are not humane, but can be done
with laboratory animals).
When doing relational research with two measurements per participant one can compose a scatter
plot. In a scatter plot each data point is composed out of two measures of a single participant.
Together all these points show a relationship between the measurements. With a scatter plot you
can find the correlation coefficient (r), which shows the strength of a linear relationship. This strength
represents correlation and NOT causation (think about the example with the amount of ice cream
sold and the amount of people drowning on a certain day).
When doing experimental research the researcher composes a hypothesis that specifies a causal
relationship. To test this hypothesis they must perform an experiment. In this experiment the
researcher manipulates (an) independent variable(s), controls the other variables by either keeping
them constant, through randomization, or by counterbalancing for the variable, and measures the
effect of the independent variable(s) on the dependent variable(s).
An experiment has a high internal validity if there are no confounds (variables that co-vary with the
independent variable). So, the independent variable must be the cause of the effect on the
dependent variable. The experiment then provides an insight in the causal relationship between
independent variable(s) and the dependent variable.
How do you assign participants to experimental conditions?
- Between subjects design
o There are independent groups of participants for each condition
o Participants are randomly assigned to groups
- Within subject design
o Each participant contributes to each condition
o There is a random assignment to the order of the conditions
The problem with inferential statistics is that we can never be sure that an observed effect in the
sample also exists in the population, the finding can always be just a coincidence.
, The general idea in inferential statistics is that you start with a null hypothesis that states that the
effect you’re researching does not exist in the population. If the observed data are very unlikely given
the null hypothesis, we reject the null hypothesis (there is probably an effect). This is the classical
approach also called null hypothesis significance testing (NHST).
For most experiments in psychology we use a p-value of .05 because we do not reject the null
hypothesis too readily if it is true, but there still is a fair chance to reject the null hypothesis if it is not
true.
The p-value is the probability of a certain outcome or a more extreme outcome, given the null
hypothesis.
Given that the null hypothesis is true, the more extreme the found value is, the less likely it is. And
the bigger the sample, the lower the likelihood of extreme outcomes.
The general steps of inferential statistics are:
1. Formulate the hypotheses (H0 and Ha)
2. Choose an appropriate test statistic
3. Determine the sampling distribution of the test statistic given the null hypothesis; determine
corresponding critical values and rejection area
4. Collect data and determine value test statistic
5. Relate the obtained value to the sampling distribution and determine whether the result is
significant or not
When your alternative hypothesis is nondirectional you test two-sides, the rejection area is
distributed between both ends of the distribution. If you suspect, prior to data collection, that the
result goes one way you make the alternative hypothesis directional and test one-sided. The
rejection are is on one side of the distribution.
You can calculate the probability of the value found in the data given the null hypothesis, but you can
never calculate the probability of the null hypothesis given the value found in the data.
Lecture 2: Chapter 6 and 7
The mean (m or µ) is a measure of central tendency. The mean is calculated by the sum of all
observations divided by the number of observations.
The variance (var) and the standard deviation (sd or σ) are measures of spread or dispersion. The
variance is calculated by dividing the sum of squares by the number of observations minus 1. The
standard deviation is the square root of the variance. The variance and the standard deviation can be
calculated with the formulas:
Sample statistics are random variables, they vary from sample to sample, and are written as Latin
letters. Population statistics are parameters, they have fixed and unknown values, and are written as
Greek letters. We use sample statistics to estimate the population statistics.