9/29/2016 V1 Exam 3 Morning
Dashboard
Test ID: 32038241
Question #1 of 60 Question ID: 692270
Questions 1-6 relate to Goldensand Jewelry, Ltd.
Introduction
Rajesh Singh is the CFO of Goldensand Jewelry, Ltd, a London-based retailer of fine jewelry and watches.
Singh has noticed that the price of gold has begun to increase. If economic activity continues to pick up, the
price of gold is likely to accelerate its rate of increase as both the level of demand and inflation rates increase.
Implications of Rising Gold Price
Singh has become concerned about the cost implications for Goldensand if gold prices continue to rise. He has
requested a meeting with Anita Biscayne, Goldensand's
COO. In preparation for the meeting, Singh asked one of his staff, Yasunobu Hara, to prepare a regression
analysis comparing the price of gold to the average cost of Goldensand's purchases of finished gold jewelry.
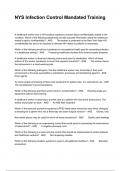
Hara provides the regression results as shown in Exhibit 1.
Exhibit 1: 1979-2009 Annual Data (31
Observations)
Standard Error of the
Variable Coefficient
Coefficient
Intercept 11.06 7.29
Cost of gold 2.897 0.615
standard error of the forecast = 117.8
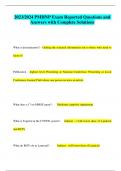
Exhibit 2: Partial Student's t-distribution Table
Level of Significance for
One-Tailed Test
df 0.100 0.050 0.025 0.010 0.005 0.0005
Level of Significance for
Two-Tailed Test
df 0.200 0.100 0.050 0.020 0.010 0.001
29 1.311 1.699 2.045 2.462 2.756 3.659
30 1.310 1.697 2.042 2.457 2.750 3.646
31 1.309 1.696 2.040 2.453 2.744 3.636
Reviewing the regression results, Biscayne becomes concerned about the implications for the cost of finished
jewelry to Goldensand if the price of gold continues to rise.
To remain profitable, the cost of finished jewelry should not exceed $2,000.
https://www.kaplanlearn.com/education/test/print/6379292?testId=32038241 1/148
,9/29/2016 V1 Exam 3 Morning
Regression Concerns
Overall Concerns
Singh's principal concern about the regression is whether the time period chosen is a good predictor of the
current situation. He makes the following statement:
Statement 1: We may have a problem with
parameter instability if the relationship
between gold prices and jewelry costs
has changed over the past 30 years.
Singh also focuses on the value of the slope coefficient. He expected it to be 4.0 based on his experience in the
industry. Hara computes the appropriate test statistic and reports the following:
Statement 2: We fail to reject the null hypothesis
that the slope coefficient is equal to 4.0
at the 5% level of significance.
Testing for Heteroskedasticity
Biscayne remarks that the dramatic increase in the price level over the past 30 years leads her to suspect
heteroskedasticity in the regression results. She suggests to Singh that they should conduct a Breusch-Pagan
chi-square test for heteroskedasticity by calculating the following test statistic: n × R2 with k degrees of
freedom
where:
n = number of observations
R2 = R2 of the regression of jewelry
prices on gold prices k = number of
independent variables
Model Misspecification
Biscayne and Singh have various views on the potential for model misspecification and the effect of any such
misspecification.
Biscayne worries that the regression model is misspecified because it does not include a variable to measure
the cost of the highly specialized labor used by manufacturing jewelers. She points out that the effect of
omitting an important variable in a regression analysis is that the regression coefficients will be unbiased
and inconsistent.
Singh adds that another common consequence of misspecifying a regression analysis is creating undesired
stationarity.
https://www.kaplanlearn.com/education/test/print/6379292?testId=32038241 2/148
,9/29/2016 V1 Exam 3 Morning
Multiple Regression
Hara conducts a series of regression analyses using all possible combinations of the suggested independent
variables based on their average quarterly values. He returns with the following regression results as shown in
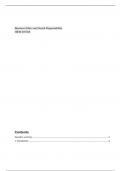
Exhibit 3 for the equation which uses all suggested independent variables.
Exhibit 3: 1999-2009 Quarterly Data (44
Observations)
Independent Coefficient t-Statistic
Variables
Intercept −3.9 3.7
Gold price 4.7 14.5
Silver price 1.2 7.8
Platinum price 3.5 3.1
Labor costs 0.82 2.4
GDP (EU) 0.000274 5.7
GDP (Middle 0.000049 3.6
East)
Personal income 0.000314 2.1
(EU)
Personal income 0.009876 2.2
(Middle East)
R2: 0.55
Durbin-Watson:
3.89
Hara is concerned about the equation described in Exhibit 3. He makes the following statement:
Statement 3: The model appears to suffer from
multicollinearity. Dropping one or more
independent variables will increase the
coefficient of determination.
Biscayne responds with the following statement:
Statement 4: An autocorrelation problem can be
addressed by using the Hansen method
to adjust the R2.
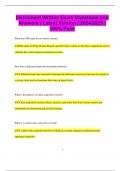
Exhibit 4: Partial Durbin-Watson Table
Critical Values for the Durbin-Watson Statistic (
= 0.05)
K=3 K=4 K=5
https://www.kaplanlearn.com/education/test/print/6379292?testId=32038241 3/148
, 9/29/2016 V1 Exam 3 Morning
n d1 du d1 du d1 du
39 1.33 1.66 1.27 1.72 1.22 1.79
40 1.34 1.66 1.29 1.72 1.23 1.79
45 1.38 1.67 1.34 1.72 1.29 1.78
..................................................................................................................................................................................
...................
The per ounce price of gold that corresponds to the $2,000 cost of finished jewelry is closest to:
A) $687.
B) $712.
C) $3,240.
Question #2 of 60 Question ID: 692269
Introduction
Rajesh Singh is the CFO of Goldensand Jewelry, Ltd, a London-based retailer of fine jewelry and watches.
Singh has noticed that the price of gold has begun to increase. If economic activity continues to pick up, the
price of gold is likely to accelerate its rate of increase as both the level of demand and inflation rates increase.
Implications of Rising Gold Price
Singh has become concerned about the cost implications for Goldensand if gold prices continue to rise. He has
requested a meeting with Anita Biscayne, Goldensand's
COO. In preparation for the meeting, Singh asked one of his staff, Yasunobu Hara, to prepare a regression
analysis comparing the price of gold to the average cost of Goldensand's purchases of finished gold jewelry.
Hara provides the regression results as shown in Exhibit 1.
Exhibit 1: 1979-2009 Annual Data (31
Observations)
Standard Error of the
Variable Coefficient
Coefficient
Intercept 11.06 7.29
Cost of gold 2.897 0.615
standard error of the forecast = 117.8
Exhibit 2: Partial Student's t-distribution Table
Level of Significance for
One-Tailed Test
df 0.100 0.050 0.025 0.010 0.005 0.0005
Level of Significance for
Two-Tailed Test
df 0.200 0.100 0.050 0.020 0.010 0.001
29 1.311 1.699 2.045 2.462 2.756 3.659
https://www.kaplanlearn.com/education/test/print/6379292?testId=32038241 4/148
Dashboard
Test ID: 32038241
Question #1 of 60 Question ID: 692270
Questions 1-6 relate to Goldensand Jewelry, Ltd.
Introduction
Rajesh Singh is the CFO of Goldensand Jewelry, Ltd, a London-based retailer of fine jewelry and watches.
Singh has noticed that the price of gold has begun to increase. If economic activity continues to pick up, the
price of gold is likely to accelerate its rate of increase as both the level of demand and inflation rates increase.
Implications of Rising Gold Price
Singh has become concerned about the cost implications for Goldensand if gold prices continue to rise. He has
requested a meeting with Anita Biscayne, Goldensand's
COO. In preparation for the meeting, Singh asked one of his staff, Yasunobu Hara, to prepare a regression
analysis comparing the price of gold to the average cost of Goldensand's purchases of finished gold jewelry.
Hara provides the regression results as shown in Exhibit 1.
Exhibit 1: 1979-2009 Annual Data (31
Observations)
Standard Error of the
Variable Coefficient
Coefficient
Intercept 11.06 7.29
Cost of gold 2.897 0.615
standard error of the forecast = 117.8
Exhibit 2: Partial Student's t-distribution Table
Level of Significance for
One-Tailed Test
df 0.100 0.050 0.025 0.010 0.005 0.0005
Level of Significance for
Two-Tailed Test
df 0.200 0.100 0.050 0.020 0.010 0.001
29 1.311 1.699 2.045 2.462 2.756 3.659
30 1.310 1.697 2.042 2.457 2.750 3.646
31 1.309 1.696 2.040 2.453 2.744 3.636
Reviewing the regression results, Biscayne becomes concerned about the implications for the cost of finished
jewelry to Goldensand if the price of gold continues to rise.
To remain profitable, the cost of finished jewelry should not exceed $2,000.
https://www.kaplanlearn.com/education/test/print/6379292?testId=32038241 1/148
,9/29/2016 V1 Exam 3 Morning
Regression Concerns
Overall Concerns
Singh's principal concern about the regression is whether the time period chosen is a good predictor of the
current situation. He makes the following statement:
Statement 1: We may have a problem with
parameter instability if the relationship
between gold prices and jewelry costs
has changed over the past 30 years.
Singh also focuses on the value of the slope coefficient. He expected it to be 4.0 based on his experience in the
industry. Hara computes the appropriate test statistic and reports the following:
Statement 2: We fail to reject the null hypothesis
that the slope coefficient is equal to 4.0
at the 5% level of significance.
Testing for Heteroskedasticity
Biscayne remarks that the dramatic increase in the price level over the past 30 years leads her to suspect
heteroskedasticity in the regression results. She suggests to Singh that they should conduct a Breusch-Pagan
chi-square test for heteroskedasticity by calculating the following test statistic: n × R2 with k degrees of
freedom
where:
n = number of observations
R2 = R2 of the regression of jewelry
prices on gold prices k = number of
independent variables
Model Misspecification
Biscayne and Singh have various views on the potential for model misspecification and the effect of any such
misspecification.
Biscayne worries that the regression model is misspecified because it does not include a variable to measure
the cost of the highly specialized labor used by manufacturing jewelers. She points out that the effect of
omitting an important variable in a regression analysis is that the regression coefficients will be unbiased
and inconsistent.
Singh adds that another common consequence of misspecifying a regression analysis is creating undesired
stationarity.
https://www.kaplanlearn.com/education/test/print/6379292?testId=32038241 2/148
,9/29/2016 V1 Exam 3 Morning
Multiple Regression
Hara conducts a series of regression analyses using all possible combinations of the suggested independent
variables based on their average quarterly values. He returns with the following regression results as shown in
Exhibit 3 for the equation which uses all suggested independent variables.
Exhibit 3: 1999-2009 Quarterly Data (44
Observations)
Independent Coefficient t-Statistic
Variables
Intercept −3.9 3.7
Gold price 4.7 14.5
Silver price 1.2 7.8
Platinum price 3.5 3.1
Labor costs 0.82 2.4
GDP (EU) 0.000274 5.7
GDP (Middle 0.000049 3.6
East)
Personal income 0.000314 2.1
(EU)
Personal income 0.009876 2.2
(Middle East)
R2: 0.55
Durbin-Watson:
3.89
Hara is concerned about the equation described in Exhibit 3. He makes the following statement:
Statement 3: The model appears to suffer from
multicollinearity. Dropping one or more
independent variables will increase the
coefficient of determination.
Biscayne responds with the following statement:
Statement 4: An autocorrelation problem can be
addressed by using the Hansen method
to adjust the R2.
Exhibit 4: Partial Durbin-Watson Table
Critical Values for the Durbin-Watson Statistic (
= 0.05)
K=3 K=4 K=5
https://www.kaplanlearn.com/education/test/print/6379292?testId=32038241 3/148
, 9/29/2016 V1 Exam 3 Morning
n d1 du d1 du d1 du
39 1.33 1.66 1.27 1.72 1.22 1.79
40 1.34 1.66 1.29 1.72 1.23 1.79
45 1.38 1.67 1.34 1.72 1.29 1.78
..................................................................................................................................................................................
...................
The per ounce price of gold that corresponds to the $2,000 cost of finished jewelry is closest to:
A) $687.
B) $712.
C) $3,240.
Question #2 of 60 Question ID: 692269
Introduction
Rajesh Singh is the CFO of Goldensand Jewelry, Ltd, a London-based retailer of fine jewelry and watches.
Singh has noticed that the price of gold has begun to increase. If economic activity continues to pick up, the
price of gold is likely to accelerate its rate of increase as both the level of demand and inflation rates increase.
Implications of Rising Gold Price
Singh has become concerned about the cost implications for Goldensand if gold prices continue to rise. He has
requested a meeting with Anita Biscayne, Goldensand's
COO. In preparation for the meeting, Singh asked one of his staff, Yasunobu Hara, to prepare a regression
analysis comparing the price of gold to the average cost of Goldensand's purchases of finished gold jewelry.
Hara provides the regression results as shown in Exhibit 1.
Exhibit 1: 1979-2009 Annual Data (31
Observations)
Standard Error of the
Variable Coefficient
Coefficient
Intercept 11.06 7.29
Cost of gold 2.897 0.615
standard error of the forecast = 117.8
Exhibit 2: Partial Student's t-distribution Table
Level of Significance for
One-Tailed Test
df 0.100 0.050 0.025 0.010 0.005 0.0005
Level of Significance for
Two-Tailed Test
df 0.200 0.100 0.050 0.020 0.010 0.001
29 1.311 1.699 2.045 2.462 2.756 3.659
https://www.kaplanlearn.com/education/test/print/6379292?testId=32038241 4/148