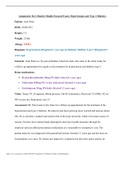
Business Statistics and Analytics in Practice
9th Edition by Bruce L. Bowerman
Complete Chapter Solutions Manual
are included (Ch 1 to 20)
** Immediate Download
** Swift Response
** All Chapters included
,Chapter 1 - An Introduction to Business Statistics and Analytics
CHAPTER 1—An Introduction to Business Statistics and Analytics
§1.1, 1.2 CONCEPTS
1.1 Any characteristic of a population element is called a variable.
Quantitative: we record numeric measurements that represent quantities.
Qualitative: we record which of several categories the element falls into.
LO1-1, LO1-2
1.2 a. Quantitative; dollar amounts correspond to values on the real number line.
b. Quantitative; net profit is a dollar amount.
c. Qualitative; which stock exchange is a category.
d. Quantitative; national debt is a dollar amount.
e. Qualitative; which type of medium is a category.
LO1-2
1.3 (1) Cross-sectional data are collected at approximately the same point in time whereas time series
data are collected over different time periods.
(2) The numbers of cars sold in 2017 by 10 different sales people are cross-sectional data.
(3) The numbers of cars sold by a particular sales person for the years 2013 – 2017 are time series
data.
LO1-3
1.4 (1) The response variable is whether or not the person has lung cancer.
(2) The factors are age, sex, occupation, and number of cigarettes smoked per day.
(3) This is an observational study.
LO1-5
1.5 A data warehouse is a central repository of an organization’s data where the data can be retrieved,
managed, and analyzed. Big data refers to the massive amounts of data, often collected in real time,
that sometimes need quick preliminary analysis for effective business decision making.
LO1-6
§1.1, 1.2 METHODS AND APPLICATIONS
1.6 $398,000 for a Ruby model on a treed lot
LO1-1
1.7 $494,000 for a Diamond model on a lake lot; $447,000 for a Ruby model on a lake lot
LO1-1
1.8
1-1
,Chapter 1 - An Introduction to Business Statistics and Analytics
This chart shows that sales are increasing over time.
LO1-4
§1.3, 1.4 CONCEPTS
1.9 (1) A population is the set of all elements about which we wish to draw conclusions.
(2) You might study the population of all purchasers of a particular laundry detergent.
(3) A census is the examination of all of the population measurements. A sample is a subset of the
elements in a population.
LO1-7
1.10 a. Descriptive statistics is the science of describing the important aspects of a set of
measurements.
b. Statistical inference is the science of using a sample of measurements to make generalizations
about the important aspects of a population of measurements.
c. A random sample is a subset of size 𝑛 chosen from a population in such a way that every
possible set of elements of size 𝑛 has the same chance of being chosen. Briefly, the sample is
chosen fairly, with no favoritism or prejudice.
d. A process is a sequence of operations that takes input(s) and generates output(s).
LO1-8, LO1-9
1.11 When we choose a sample of size 𝑛 without replacement, all 𝑛 elements selected are different.
However, when selecting with replacement, we might choose some elements multiple times. We
tend to get a more complete picture of the population when we sample without replacement.
LO1-9
§1.3, 1.4 METHODS AND APPLICATIONS
1.12 We would select companies 3, 8, 9, 14, and 7, so our random sample would contain Coca-Cola,
Coca-Cola Enterprises, Reynolds American, Pepsi Bottling Group, and Sara Lee.
LO1-9
1-2
, Chapter 1 - An Introduction to Business Statistics and Analytics
1.13 a. We would select registrations 33,276; 3,427; 8,178; 51,259; 60,268; 58,586; 9,998; 14,346;
24,200; and 7,351.
b. Most of the 73,219 scores should fall between 36 and 48, the most extreme scores in the
sample. Since 46 of the 65 sample values are 42 or higher, we estimate that approximately
46/65 = 70.77% of all scores would be at least 42.
LO1-9
1.14 a. 5:47 P.M.
b. We would estimate that the wait times of most customers would fall between 0.4 and 11.6
minutes, the most extreme times in the sample. Since 60 of the 100 sample wait times are less
than 6 minutes, we estimate that 60/100 = 60% of all customers would wait less than 6 minutes.
LO1-9
1.15 No. This is a voluntary response sample and thus is probably not representative of the population of
all television viewers.
LO1-9
1.16 We estimate that most breaking strengths will be between 41.7 lbs. and 63.8 lbs., the smallest and
largest observed values.
LO1-9
§1.5 CONCEPTS
1.17 Predictive analytics are supervised learning techniques since there is a particular response variable
we are trying to predict.
LO1-10
1.18 Descriptive analytics are unsupervised learning techniques since there is not a particular response
variable we are trying to predict.
L01-10
1.19 Data mining is the process of discovering useful knowledge in extremely large data sets.
LO1-10
1.20 Prescriptive analytics are techniques that combine external and internal constraints with results
from descriptive and predictive analytics.
LO1-10
§1.6 CONCEPTS
1.21 A ratio variable is a quantitative variable measured on a scale such that ratios of values of the
variables are meaningful and there is an inherently defined zero value.
1-3