Unit 19 – Chemistry.
Assignment 2.
Merit & Distinction
When called in to take a sample of the cavity wall for analysis for a large development company, in
an attempt to establish what the material present within the cavity wall is, I was provided with a
sheet regarding the unknown substances Infra-red spectrum, it’s Empirical formula, Mass spectrum,
H magnetic resonance spectrum, and C magnetic resonance spectrum. From being provided with the
above information I have been able to draw up a conclusion as to what substance this material could
possibly be, therefore, below I will display my workings out, findings and conclude as to what this
substance is likely to be.
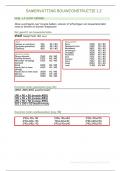
1. When first presented with the information I decided that the most logical thing to calculate
first would be the Empirical formula. As by doing so, it would provide me with the simplest
formula showing the ratios of the numbers of atoms present of each elements within the
compound. The results for this is as follows;
Carbon (C) Hydrogen (H) Oxygen (O)
% by mass 40.0% 6.7% 53.3%
Divide by atomic 40.0 ÷ 12 = 3.3 6.7 ÷ 1.01 = 6.7 53.3 ÷ 16 = 3.3
mass of element.
Divide each value by 3.3 ÷ 3.3 = 1 6.7 ÷ 3.3 = 2 3.3 ÷ 3.3 = 1
the smallest value
from the last step.
State nearest whole 1 2 1
number ratio.
Therefore, the empirical formula is CH20.
From this empirical formula the possible mass is able to be worked out which is as follows:
Carbon (C ) =12. Hydrogen (H) = 1.01 x 2 = 2.02. Oxygen (O) = 16. These are then added up:
12 + 2.02 + 16 = 30.02.
However, when looking at the mass spectrum the maximum mass shown of the unknown substance
is 60, this indicates that there must be twice the number of atoms present within the molecule. So,
the molecular formula is as follows;
30.02 x 2 = 60.04. The final empirical formula is ; C2H4O2, as the mass (60.04) correlates with the
maximum mass present on the mass spectrum.
2. Due to the fact that the empirical formula has now been established, the second thing I decided to
work out is the Infra-red spectrum. My conclusions for this are as follows;
When studying the peaks on the infra-red spectrum and comparing them to the infrared absorption
values, I firstly concluded that one of the peak absorptions within the fingerprint region of around
1300cm¯¹ is a Carbon-Oxygen single bond (C-O bond). However, outside of the fingerprint region
there was some further easily recognised absorptions, which had some more prominent peaks. The
peak at 3100cm¯¹ is an Oxygen-Hydrogen single bond (O-H bond), the reason for this is because it
produces a very broad trough, therefore, can also be further recognised as an acid. At the peak at
around 1700cm¯¹ when comparing it to the infrared absorption values, it could be seen as a
Carbon=Oxygen double bond (C=O bond.) C=O bonds tend to be one off and sharp peaks , which on
this infrared spectrum it was. Finally, the jagged peak which is a unique characteristic at around
2800cm¯¹ is a Carbon-Hydrogen single bond (C-H bond).
3. Next, I decided to analyse the H Magnetic Resonance Spectrum, when looking at it I
observed two peaks this emphasised straight away that there are two different
1
, Unit 19 – Chemistry.
Assignment 2.
environments for Hydrogen. Besides from observing that from the chemical shift being
measured in ‘ppm’ (parts per million) it was able to provide information regarding the
structure of the molecule. When using the sheet showing the H NMR chemical shifts and
comparing it to the H Magnetic Resonance Spectrum, the peak at 2.0 ppm is seen as
consistent with a CH3 group. The peak at 11 ppm is consistent with a -O-H group. The
reason as why these are in different places within the spectrum is due to them both
requiring slightly different external magnetic fields. As the CH3 group is closer to 0, it is
further away from the action and therefore, is more reactive compared to the -O-H group,
which is closer to the action, and can be deemed as less reactive in comparison.
4. When analysing the C Magnetic Resonance Spectrum, when looking at it I observed two
peaks this emphasised straight away that there are also two different environments for
Carbon. Besides from observing that from the chemical shift being measured in ‘ppm’ (parts
per million) it was able to provide information regarding the structure of the molecule.
When using the sheet showing the C NMR chemical shifts and comparin g it to the C
Magnetic Resonance Spectrum , the peak at 20 ppm is seen as consistent with a
and the peak at 180 ppm is consistent with a
5. Finally, when looking at the Mass Spectrum provided, it was established that the peak at 45
corresponds to COOH+. The peak at 60 is likely to be the molecular ion. When subtracting 45
from 60 it leaves 15, and on this mass spectrum a peak at 15 can be observed. The peak at
15 is likely to be due to a CH3+. The peak at 43 corresponds to CH3CO+ which could be
formed by the loss of an OH from CH3COOH+. From the relative molecular mass of 60 the
substance is concluded to be Ethanoic Acid which has the formula CH3COOH.
Risk Assessment on Ethanoic Acid –
2
Assignment 2.
Merit & Distinction
When called in to take a sample of the cavity wall for analysis for a large development company, in
an attempt to establish what the material present within the cavity wall is, I was provided with a
sheet regarding the unknown substances Infra-red spectrum, it’s Empirical formula, Mass spectrum,
H magnetic resonance spectrum, and C magnetic resonance spectrum. From being provided with the
above information I have been able to draw up a conclusion as to what substance this material could
possibly be, therefore, below I will display my workings out, findings and conclude as to what this
substance is likely to be.
1. When first presented with the information I decided that the most logical thing to calculate
first would be the Empirical formula. As by doing so, it would provide me with the simplest
formula showing the ratios of the numbers of atoms present of each elements within the
compound. The results for this is as follows;
Carbon (C) Hydrogen (H) Oxygen (O)
% by mass 40.0% 6.7% 53.3%
Divide by atomic 40.0 ÷ 12 = 3.3 6.7 ÷ 1.01 = 6.7 53.3 ÷ 16 = 3.3
mass of element.
Divide each value by 3.3 ÷ 3.3 = 1 6.7 ÷ 3.3 = 2 3.3 ÷ 3.3 = 1
the smallest value
from the last step.
State nearest whole 1 2 1
number ratio.
Therefore, the empirical formula is CH20.
From this empirical formula the possible mass is able to be worked out which is as follows:
Carbon (C ) =12. Hydrogen (H) = 1.01 x 2 = 2.02. Oxygen (O) = 16. These are then added up:
12 + 2.02 + 16 = 30.02.
However, when looking at the mass spectrum the maximum mass shown of the unknown substance
is 60, this indicates that there must be twice the number of atoms present within the molecule. So,
the molecular formula is as follows;
30.02 x 2 = 60.04. The final empirical formula is ; C2H4O2, as the mass (60.04) correlates with the
maximum mass present on the mass spectrum.
2. Due to the fact that the empirical formula has now been established, the second thing I decided to
work out is the Infra-red spectrum. My conclusions for this are as follows;
When studying the peaks on the infra-red spectrum and comparing them to the infrared absorption
values, I firstly concluded that one of the peak absorptions within the fingerprint region of around
1300cm¯¹ is a Carbon-Oxygen single bond (C-O bond). However, outside of the fingerprint region
there was some further easily recognised absorptions, which had some more prominent peaks. The
peak at 3100cm¯¹ is an Oxygen-Hydrogen single bond (O-H bond), the reason for this is because it
produces a very broad trough, therefore, can also be further recognised as an acid. At the peak at
around 1700cm¯¹ when comparing it to the infrared absorption values, it could be seen as a
Carbon=Oxygen double bond (C=O bond.) C=O bonds tend to be one off and sharp peaks , which on
this infrared spectrum it was. Finally, the jagged peak which is a unique characteristic at around
2800cm¯¹ is a Carbon-Hydrogen single bond (C-H bond).
3. Next, I decided to analyse the H Magnetic Resonance Spectrum, when looking at it I
observed two peaks this emphasised straight away that there are two different
1
, Unit 19 – Chemistry.
Assignment 2.
environments for Hydrogen. Besides from observing that from the chemical shift being
measured in ‘ppm’ (parts per million) it was able to provide information regarding the
structure of the molecule. When using the sheet showing the H NMR chemical shifts and
comparing it to the H Magnetic Resonance Spectrum, the peak at 2.0 ppm is seen as
consistent with a CH3 group. The peak at 11 ppm is consistent with a -O-H group. The
reason as why these are in different places within the spectrum is due to them both
requiring slightly different external magnetic fields. As the CH3 group is closer to 0, it is
further away from the action and therefore, is more reactive compared to the -O-H group,
which is closer to the action, and can be deemed as less reactive in comparison.
4. When analysing the C Magnetic Resonance Spectrum, when looking at it I observed two
peaks this emphasised straight away that there are also two different environments for
Carbon. Besides from observing that from the chemical shift being measured in ‘ppm’ (parts
per million) it was able to provide information regarding the structure of the molecule.
When using the sheet showing the C NMR chemical shifts and comparin g it to the C
Magnetic Resonance Spectrum , the peak at 20 ppm is seen as consistent with a
and the peak at 180 ppm is consistent with a
5. Finally, when looking at the Mass Spectrum provided, it was established that the peak at 45
corresponds to COOH+. The peak at 60 is likely to be the molecular ion. When subtracting 45
from 60 it leaves 15, and on this mass spectrum a peak at 15 can be observed. The peak at
15 is likely to be due to a CH3+. The peak at 43 corresponds to CH3CO+ which could be
formed by the loss of an OH from CH3COOH+. From the relative molecular mass of 60 the
substance is concluded to be Ethanoic Acid which has the formula CH3COOH.
Risk Assessment on Ethanoic Acid –
2