100% satisfaction guarantee Immediately available after payment Both online and in PDF No strings attached 4.2 TrustPilot
logo-home
Exam (elaborations)

Exam (elaborations) Math

Rating
-
Sold
-
Pages
4
Grade
A+
Uploaded on
15-01-2025
Written in
2024/2025

The document titled "Misleading Graph-Unemployment Rate under President Obama" provides an analysis of a graph purportedly used by Fox News to depict the unemployment rate during President Obama's administration in 2011. Here’s an in-depth description of the document's content: Overview The document discusses the use of misleading graphs in media, particularly focusing on how such representations can distort public perception. It highlights a specific instance involving Fox News and a graph that illustrates the unemployment rate under President Obama. Key Points Purpose of Misleading Graphs: The document opens by acknowledging that misleading graphs are frequently utilized in media and politics to influence public opinion. It emphasizes that such practices can misrepresent data and lead to misconceptions about important issues like unemployment. Description of the Graph: The graph in question is described as showing the rise and fall of the unemployment rate throughout 2011. The vertical axis represents the unemployment percentage, while the horizontal axis indicates the months from January to November. The author notes that while the graph appears straightforward, it contains faint lines, which contribute to misrepresentation. Analysis of Data Representation: The document points out specific inaccuracies in how the unemployment rate is presented: It mentions that while the unemployment rate dropped from January to March, it rose significantly from April to June, then stabilized for several months. A critical error identified is that the November unemployment rate of 8.6% is plotted incorrectly on the graph, appearing at the 9% mark instead. Additionally, it claims that the representation suggests a steep incline in unemployment rates when, in fact, they were stable. Recommendations for Improvement: The author suggests ways to correct these misrepresentations: Lines in the graph should be made more visible using brighter colors against a contrasting background. The November unemployment figure should be accurately plotted to reflect a decline from October's 9%. Political Implications: The document concludes by discussing the broader implications of such misleading representations in media. It suggests that Fox News may have used this graph to portray a negative image of Obama’s administration concerning job creation. It reflects on how political motivations can lead to manipulation of data and highlights the ethical concerns surrounding such practices. Conclusion The document serves as a critique of how statistical data can be misrepresented through graphical means, using a specific example related to unemployment rates during President Obama’s tenure. It underscores the importance of accurate data representation and calls for greater scrutiny of how information is presented in media outlets, especially regarding politically charged topics.

Show more Read less
Institution
Math
Course
Math


Whoops! We can’t load your doc right now. Try again or contact support.

Written for

Institution
Math
Course
Math

Document information

Uploaded on
January 15, 2025
Number of pages
4
Written in
2024/2025
Type
Exam (elaborations)
Contains
Questions & answers

Content preview

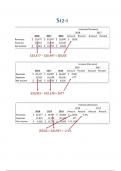
Running head: MISLEADING GRAPH 1


Misleading Graph-Unemployment Rate under President Obama


Student Name


Institution Affiliation
$10.49
Get access to the full document:

100% satisfaction guarantee
Immediately available after payment
Both online and in PDF
No strings attached

Get to know the seller
Seller avatar
brianmsairi253

Get to know the seller

Seller avatar
brianmsairi253 EXAMS
View profile
Follow You need to be logged in order to follow users or courses
Sold
0
Member since
11 months
Number of followers
0
Documents
7
Last sold
-

0.0

0 reviews

5
0
4
0
3
0
2
0
1
0

Recently viewed by you

Why students choose Stuvia

Created by fellow students, verified by reviews

Quality you can trust: written by students who passed their tests and reviewed by others who've used these notes.

Didn't get what you expected? Choose another document

No worries! You can instantly pick a different document that better fits what you're looking for.

Pay as you like, start learning right away

No subscription, no commitments. Pay the way you're used to via credit card and download your PDF document instantly.

Student with book image

“Bought, downloaded, and aced it. It really can be that simple.”

Alisha Student

Frequently asked questions