Course Objectives
Wednesday, May 01, 2024 12:51 PM
According to CSU-Fort Collins, upon completion of the course, the student should:
Apply microeconomic models to explain economic decision making by firms and consumers;
Explain how resources are allocated efficiently and how the structure of markets may have an
effect on this allocation;
Show how government intervention can improve or impair the functioning of markets;
Solve economic problems where agents are strategically interdependent on one another;
Apply these tools to real-world examples in a correct and proficient manner.
Summer Studies Page 1
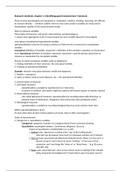
,Links and Resources Intermediate Microeconomics Research Guide Library
Wednesday, May 01, 2024 11:55 AM PATRICK M. EMERSON; Oregan State Uni
"This guide helps Intermediate
Microeconomics students identify an
access the most appropriate researc
resources in order to find backgroun
information and academic research i
Intermediat
support of the Research Proposal
e-Microec... literature review assignment."
Interactive Question Bank
Problem sets are related to the following topics: demand and supply, consumer theory,
theory of firm and production, price and output determination under competition and
monopoly, and market power analysis.
Summer Studies Page 2
,Preferences-Indifference Curve
Wednesday, June 12, 2024 10:07 AM
Learning Objective 1.1: List and explain the three fundamental assumptions about preferences.
To build a model that can predict choices when variables change, we need to make some
assumptions about the preferences that drive consumer choices. Economics makes three
assumptions about preferences that are the most basic building blocks of our theory of
consumer choice. To introduce these, it is useful to think of collections or bundles of goods. To
simplify, let’s identify two bundles, A and B . The way we think of preferences always boils
down to comparing two bundles. Even if we are choosing among three or more bundles, we can
always proceed by comparing pairs and eliminating the lesser bundle until we are left with our
choice. When we call something a good, we mean exactly that—something that a consumer
likes and enjoys consuming. Something that a consumer might not like we call a bad. The fewer
bads consumed, the happier a consumer is. To keep things simple, we will focus only on goods,
but it is easy to incorporate bads into the same framework by considering their absence—the
fewer the bads, the better. The three fundamental assumptions about preferences are the
following:
1. Completeness.
2. Transitivity.
3. More is Better.
The most important results of our model of consumer behavior hold when we only assume
completeness and transitivity, but life is much easier if we assume more is better as well. If we
assume free disposal (we can get rid of extra goods at no cost), the assumption that more is
better seems reasonable. It is certainly the case that more is not worse in that situation, and so
to keep things simple, we’ll maintain the standard assumption that we prefer more of a good
than less.
Our model works well when these assumptions are valid, which seems to be most of the time in
most situations. However, sometimes these assumptions do not apply. For instance, in order to
have complete and transitive preferences, we must know something about the goods in the
bundle. Imagine an American who does not speak Hindi entering an Indian restaurant where
Summer Studies Page 3
, bundle. Imagine an American who does not speak Hindi entering an Indian restaurant where
the menu is entirely in Hindi. Without the aid of translation, the customer cannot act as
economic theory would predict.
Learning Objective 1.2: Define and draw an indifference curve.
Individual preferences, given the basic assumptions, can be represented using something called
indifference curves. An indifference curve is a graph of all the combinations of bundles that a
consumer prefers equally. In other words, the consumer would be just as happy consuming any
of them. Representing preferences graphically is a great way to understand both preferences
and how the consumer choice model works—so it is worth mastering them early in your study
of microeconomics. Bundles can contain many goods, but to simplify, we will consider only
pairs of goods. At first, this may seem impossibly restrictive, but it turns out that we don’t really
lose generality in so doing. We can always consider one good in the pair to be, collectively, all
other consumption goods. What the two goods restriction does so well is to help us see the
trade-offs in consuming more of one good and less of another.
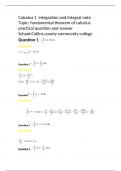
Figure 1.1 is a graph with two goods on the axes: the weekly consumption of burritos and the
weekly consumption of sandwiches for a college student. In the middle of the graph is point A,
which represents a bundle of both burritos (read from the horizontal axis) and sandwiches
(read from the vertical axis). Now we can ask what bundles are better, worse, or the same in
terms of satisfying this college student. Clearly, bundles that contain fewer of both goods, like
Bundle D, are worse than A,B, or C because they violate the more-is-better assumption. Equally
clear is that bundles that contain more of both goods, like Bundle E, are better than A,B ,C, and
D because they satisfy the more-is-better] assumption. To create an indifference curve, we
want to identify bundles that this college student is indifferent about consuming. If a bundle
has more burritos, the student will have to have fewer sandwiches and vice versa. By finding all
the bundles that are just as good as A, like and B, and C connecting them with a line, we create
an indifference curve, like the one in the middle.
Notice that figure 1.1 includes several indifference curves. Each curve represents a different
level of overall satisfaction that the student can achieve via burrito/sandwich bundles. A curve
Summer Studies Page 4
Wednesday, May 01, 2024 12:51 PM
According to CSU-Fort Collins, upon completion of the course, the student should:
Apply microeconomic models to explain economic decision making by firms and consumers;
Explain how resources are allocated efficiently and how the structure of markets may have an
effect on this allocation;
Show how government intervention can improve or impair the functioning of markets;
Solve economic problems where agents are strategically interdependent on one another;
Apply these tools to real-world examples in a correct and proficient manner.
Summer Studies Page 1
,Links and Resources Intermediate Microeconomics Research Guide Library
Wednesday, May 01, 2024 11:55 AM PATRICK M. EMERSON; Oregan State Uni
"This guide helps Intermediate
Microeconomics students identify an
access the most appropriate researc
resources in order to find backgroun
information and academic research i
Intermediat
support of the Research Proposal
e-Microec... literature review assignment."
Interactive Question Bank
Problem sets are related to the following topics: demand and supply, consumer theory,
theory of firm and production, price and output determination under competition and
monopoly, and market power analysis.
Summer Studies Page 2
,Preferences-Indifference Curve
Wednesday, June 12, 2024 10:07 AM
Learning Objective 1.1: List and explain the three fundamental assumptions about preferences.
To build a model that can predict choices when variables change, we need to make some
assumptions about the preferences that drive consumer choices. Economics makes three
assumptions about preferences that are the most basic building blocks of our theory of
consumer choice. To introduce these, it is useful to think of collections or bundles of goods. To
simplify, let’s identify two bundles, A and B . The way we think of preferences always boils
down to comparing two bundles. Even if we are choosing among three or more bundles, we can
always proceed by comparing pairs and eliminating the lesser bundle until we are left with our
choice. When we call something a good, we mean exactly that—something that a consumer
likes and enjoys consuming. Something that a consumer might not like we call a bad. The fewer
bads consumed, the happier a consumer is. To keep things simple, we will focus only on goods,
but it is easy to incorporate bads into the same framework by considering their absence—the
fewer the bads, the better. The three fundamental assumptions about preferences are the
following:
1. Completeness.
2. Transitivity.
3. More is Better.
The most important results of our model of consumer behavior hold when we only assume
completeness and transitivity, but life is much easier if we assume more is better as well. If we
assume free disposal (we can get rid of extra goods at no cost), the assumption that more is
better seems reasonable. It is certainly the case that more is not worse in that situation, and so
to keep things simple, we’ll maintain the standard assumption that we prefer more of a good
than less.
Our model works well when these assumptions are valid, which seems to be most of the time in
most situations. However, sometimes these assumptions do not apply. For instance, in order to
have complete and transitive preferences, we must know something about the goods in the
bundle. Imagine an American who does not speak Hindi entering an Indian restaurant where
Summer Studies Page 3
, bundle. Imagine an American who does not speak Hindi entering an Indian restaurant where
the menu is entirely in Hindi. Without the aid of translation, the customer cannot act as
economic theory would predict.
Learning Objective 1.2: Define and draw an indifference curve.
Individual preferences, given the basic assumptions, can be represented using something called
indifference curves. An indifference curve is a graph of all the combinations of bundles that a
consumer prefers equally. In other words, the consumer would be just as happy consuming any
of them. Representing preferences graphically is a great way to understand both preferences
and how the consumer choice model works—so it is worth mastering them early in your study
of microeconomics. Bundles can contain many goods, but to simplify, we will consider only
pairs of goods. At first, this may seem impossibly restrictive, but it turns out that we don’t really
lose generality in so doing. We can always consider one good in the pair to be, collectively, all
other consumption goods. What the two goods restriction does so well is to help us see the
trade-offs in consuming more of one good and less of another.
Figure 1.1 is a graph with two goods on the axes: the weekly consumption of burritos and the
weekly consumption of sandwiches for a college student. In the middle of the graph is point A,
which represents a bundle of both burritos (read from the horizontal axis) and sandwiches
(read from the vertical axis). Now we can ask what bundles are better, worse, or the same in
terms of satisfying this college student. Clearly, bundles that contain fewer of both goods, like
Bundle D, are worse than A,B, or C because they violate the more-is-better assumption. Equally
clear is that bundles that contain more of both goods, like Bundle E, are better than A,B ,C, and
D because they satisfy the more-is-better] assumption. To create an indifference curve, we
want to identify bundles that this college student is indifferent about consuming. If a bundle
has more burritos, the student will have to have fewer sandwiches and vice versa. By finding all
the bundles that are just as good as A, like and B, and C connecting them with a line, we create
an indifference curve, like the one in the middle.
Notice that figure 1.1 includes several indifference curves. Each curve represents a different
level of overall satisfaction that the student can achieve via burrito/sandwich bundles. A curve
Summer Studies Page 4