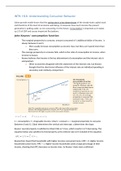
Stone Stylists Ltd Charts & Guide
The purpose of this presentation is to display all of the charts that can be made
from the two data tables provided in the Stone Stylists Ltd case study in
preparation for the January 2025 Unit 6 Principles of Management exam.
Including a guide on how to make them, how to make combined charts (e.g. to
display client satisfaction & retention on one chart) and how to use advanced
styling options.
Referencing the business performance is a crucial part of getting high marks and
charts are the perfect way to do this and so this guide will help you know which
charts to make and how to make them quickly.
,Charts
,