2024 Pearson Edexcel Level 1/Level 2 GCSE Statistics
1ST0/2H PAPER 2 Higher Tier. With Marking Scheme
Merged
Pearson Edexcel Level 1/Level 2 GCSE (9–1)
Monday 17 June 2024
reference 1ST0/2H
Afternoon (Time: 1 hour 30 minutes) Paper
Statistics
PAPER 2
Higher Tier
You must have: Total Marks
Ruler graduated in centimetres and millimetres, protractor, pair
of compasses, pen, HB pencil, eraser, scientific calculator.
Instructions
• Use black ink or ball‑point pen.
• Fill in the boxes at the top of this page with your name,
• centre number and candidate number.
• Answer all questions.
Answer the questions in the spaces provided
• – there may be more space than you need.
• Scientific calculators may be used.
You must show all your working out with your answer clearly
identified at the end of your solution.
Information
• The total mark for this paper is 80.
• The marks for each question are shown in brackets
– use this as a guide as to how much time to spend on each question.
Advice
• Read each question carefully before you start to answer it.
• Try to answer every question.
• Check your answers if you have time at the end.
Turn over
P75439A
©2024 Pearson Education Ltd.
*P75439A0124*
F:1/1/1/1/1/1/
, Higher Tier Formulae
You must not write on this page.
DO NOT WRITE IN THIS AREA
Anything you write on this page will gain NO credit.
DO NOT WRITE IN THIS AREA
DO NOT WRITE IN THIS AREA
2
*P75439A0224*
, DO NOT WRITE IN THIS AREA DO NOT WRITE IN THIS AREA DO NOT WRITE IN THIS AREA
*P75439A0324*
BLANK PAGE
Turn over
3
, Answer ALL questions.
Write your answers in the spaces provided.
DO NOT WRITE IN THIS AREA
You must write down all the stages in your working.
1 Matthew is investigating average household income for different states in the USA.
(a) Give a reason why it is appropriate to use secondary data for this.
..................................................................................................................................................................................................................................................
....................................................................................................................................................................................................................................................
(1)
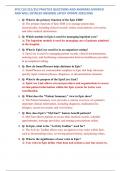
Matthew creates a choropleth map giving information about the mean household income
by state for the USA in 2023
Mean annual household income in $ thousands.
Washington
Maine
DO NOT WRITE IN THIS AREA
Montana North Dakota Minnesota
1
Oregon 2
Wisconsin Michigan 3
Idaho South Dakota New York 5
Wyoming 4
Iowa Pennsylvania 6
Nevada Nebraska Ohio 7
Illinois 8
Utah Indiana 10
Colorado
California Kansas Virginia 9
Missouri Kentucky
North
Tennessee Carolina
Arizona Oklahoma South
Arkansas Carolina
New Mexico
Georgia
Alabama
Texas
Florida
Louisiana
Alaska Mississippi
DO NOT WRITE IN THIS AREA
Hawaii Key
1. Vermont <70
2. New Hampshire
3. Massachusetts
70–80
4. Rhode Island
5. Connecticut
6. New Jersey 80–90
7. Delaware
8. Maryland
9. District of Columbia 90–100
10. West Virginia
(Source: worldpopulationreview.com) 100
4
*P75439A0424*
1ST0/2H PAPER 2 Higher Tier. With Marking Scheme
Merged
Pearson Edexcel Level 1/Level 2 GCSE (9–1)
Monday 17 June 2024
reference 1ST0/2H
Afternoon (Time: 1 hour 30 minutes) Paper
Statistics
PAPER 2
Higher Tier
You must have: Total Marks
Ruler graduated in centimetres and millimetres, protractor, pair
of compasses, pen, HB pencil, eraser, scientific calculator.
Instructions
• Use black ink or ball‑point pen.
• Fill in the boxes at the top of this page with your name,
• centre number and candidate number.
• Answer all questions.
Answer the questions in the spaces provided
• – there may be more space than you need.
• Scientific calculators may be used.
You must show all your working out with your answer clearly
identified at the end of your solution.
Information
• The total mark for this paper is 80.
• The marks for each question are shown in brackets
– use this as a guide as to how much time to spend on each question.
Advice
• Read each question carefully before you start to answer it.
• Try to answer every question.
• Check your answers if you have time at the end.
Turn over
P75439A
©2024 Pearson Education Ltd.
*P75439A0124*
F:1/1/1/1/1/1/
, Higher Tier Formulae
You must not write on this page.
DO NOT WRITE IN THIS AREA
Anything you write on this page will gain NO credit.
DO NOT WRITE IN THIS AREA
DO NOT WRITE IN THIS AREA
2
*P75439A0224*
, DO NOT WRITE IN THIS AREA DO NOT WRITE IN THIS AREA DO NOT WRITE IN THIS AREA
*P75439A0324*
BLANK PAGE
Turn over
3
, Answer ALL questions.
Write your answers in the spaces provided.
DO NOT WRITE IN THIS AREA
You must write down all the stages in your working.
1 Matthew is investigating average household income for different states in the USA.
(a) Give a reason why it is appropriate to use secondary data for this.
..................................................................................................................................................................................................................................................
....................................................................................................................................................................................................................................................
(1)
Matthew creates a choropleth map giving information about the mean household income
by state for the USA in 2023
Mean annual household income in $ thousands.
Washington
Maine
DO NOT WRITE IN THIS AREA
Montana North Dakota Minnesota
1
Oregon 2
Wisconsin Michigan 3
Idaho South Dakota New York 5
Wyoming 4
Iowa Pennsylvania 6
Nevada Nebraska Ohio 7
Illinois 8
Utah Indiana 10
Colorado
California Kansas Virginia 9
Missouri Kentucky
North
Tennessee Carolina
Arizona Oklahoma South
Arkansas Carolina
New Mexico
Georgia
Alabama
Texas
Florida
Louisiana
Alaska Mississippi
DO NOT WRITE IN THIS AREA
Hawaii Key
1. Vermont <70
2. New Hampshire
3. Massachusetts
70–80
4. Rhode Island
5. Connecticut
6. New Jersey 80–90
7. Delaware
8. Maryland
9. District of Columbia 90–100
10. West Virginia
(Source: worldpopulationreview.com) 100
4
*P75439A0424*