DIS – januari 2025 1
VARIABLES
= the values we want to measure, e.g. time in seconds, score on a test, gender
- Random variables are variables whose values are unknown and are realizations of a random process
INDEPENDENT VS DEPENDENT VARIABLES
Independent variables Dependent variables
= variable that is not dependent on any other = variable that depends on other factors, the output,
variable, the input, the predictor, the explanation the criteria, the response
- Commonly represented as X1, …, Xj, …, Xk - Commonly represented as Y1, …, Yj, …, Yk
- E.g. the amount of time spent studying - E.g. the exam result
DISCRETE VS CONTINUOUS VARIABLES
Discrete variables Continuous variables
= a variable that only assumes a limited number of = numeric variable that has an infinite number of
values possibilities between two values
- E.g. someone speaks 3 languages, yes/no - E.g. someone looked at a picture for 1,3828 sec
- A discrete variable that - A variable is considered continuous when
• Only assumes two values is a dichotomous • The variable takes on a wide range of values
variable • The variable is a manifestation of an
• Only assumes three values is a underlying continuous variable
trichotomous variable
• Assumes three or more values is a
polytomous variable
QUALITATIVE VS QUANTITATIVE VARIABLES
Qualitative variables Quantitative variables
= numbers only refer to equalities and inequalities = numbers are assigned so that differences between
between the research elements (regarding the numbers correspond with distances between
measured characteristics) research elements (regarding the measured
The number is only a name or label characteristics)
Calculating is not meaningful Number is a real number
Calculating is meaningful
- Nominal variable, e.g. Dutch (1), English (2)
- Ordinal variable, e.g. not satisfied (1) → very - Interval variable, e.g. temperature in °C, Likert-
satisfied (5) scale in numbers
• ! the numbers must be compared by - Ratio variable, e.g. temperature in °K, time
size/order but are not meaningful to
calculate with
There is a hierarchy within the different types of variables:
- While all quantitative variables can be ordinal variables
(seeing as they are numbers and can be ordened), not all
ordinal variables are quantitative variables
- Ordinal variables can be thought of as qualitative variables
where order matters but numerical measurement or
distance between categories doesn’t really matter
,DIS – januari 2025 2
DESCRIBING 1 VARIABLE
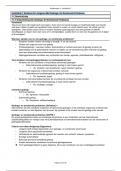
TABLES
- Variables are represented by capital letters in
italics in the columns, e.g. X4
- Research elements are located in the rows and
are represented with a Xij formula, with i
referring to the research element and j to the
variable, e.g. X14 = 3
FREQUENCY TABLES
The (absolute) frequency distribution of X is denoted as f(X), e.g. f(X=77) = 3 because the score 77 occurs 3
times
Cumulative frequency of a specific score on X is the total number of scores lower than or equal to that specific
score and its distribution is denoted as F(X), e.g. F(X=77) = 14
- This is not meaningful for qualitative data as the categories are not ordered
Relative frequencies or proportions of scores on X are the frequencies divided by the number of observations
and its distribution is denoted as p(X), e.g. p(X=77) = 3/30 = 0.1
Relative cumulative frequencies or cumulative proportions of a specific score on X equals the cumulative
frequency divided by the total number of observations and its distribution is denoted as P(X), e.g. P(X=77) =
14/30 = 0.47
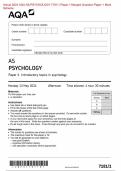
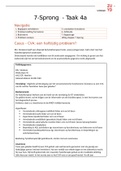
STEM-AND-LEAF PLOTS
- Read scores by stem.leaf*101, e.g. 8.4*101 = 84
- When looking for a certain percentile and the n is even,
take then average of the two scores, e.g. P50 of n = 30 is
the 15th score, so (78+78)/2 = 78
- When looking for a percentile and matching score is not
in there (e.g. P25 when n = 10), look at the score above
,DIS – januari 2025 3
KEY STATISTICS
PERCENTILES
= score on X under which at least (so lower or equal) a specific % of scores is situated, e.g. 10th percentile
corresponds to score 8 so at least 10% of scores ≤ 8 → P10 = 8
- To calculate, simply find the corresponding score to the % given in the relative cumulative frequency table
• Is the % not literally in the table? Find the smallest higher percentile and take that score
• Is the % literally in the table and n is an even number? Take the median between that one and the one
above
- Special percentiles:
• Quartiles (in 4), with Q1 = P25, Q2 = P50 and Q3 = P75
• Deciles (in 10), with D1 = Pc10, D2 = P20, …
These are all special forms of quantiles or fractiles: a score under which a specific proportion of scores is
situated
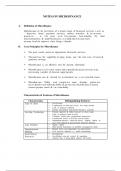
Example with Stem-and-leaf plot
CENTER
MODE
= score or category with highest frequency, e.g. 2, 3, 3, 4, 6 → mode = 3
- Can be used for both quantitative and qualitative variables
- Uniqueness?
• Unimodal distribution: mode is uniquely defined
• Bimodal or multimodal distribution: two (or more) scores or categories have the maximum frequency,
e.g. 2, 3, 3, 4, 4, 6 → bimodal: mode = 3 and 4
MEDIAN
= the middle value, so (at least) half of the scores are above it and (at least) half are below it
= Q2 = P50
- Calculate by ordering all observed scores, then taking the middle score or averaging the two middle scores
THE (ARITHMETIC) AVERAGE
1 1
𝑋̅ = 𝑛 ∑𝑛𝑖=1 𝑋𝑖 with ∑𝑛𝑖=1 𝑋𝑖 as the sum of all observed values and 𝑛 as this sum divided by the number of
observed values, e.g. 2, 3, 3, 4, 4, 5 → 𝑋̅ = (2+3+3+4+4+5)/6 = 21/6 = 3.5
, DIS – januari 2025 4
Different formulas for frequency table with k scores with examples:
1
- Using absolute frequencies: 𝑋̅ = 𝑛 ∑𝑘𝑖=1 𝑋𝑖 × 𝑓𝑖 , waarbij ∑𝑘𝑖=1 𝑓𝑖 =
𝑛
e.g. 2, 3, 3, 4, 4, 5 → 𝑋̅ = (2+3x2+4x2+5)/6 = 21/6 = 3.5
- Using relative frequencies: 𝑋̅ = ∑𝑘𝑖=1 𝑋𝑖 × 𝑝𝑖 , waarbij ∑𝑘𝑖=1 𝑝𝑖 = 1
e.g. = 2*.17 + 3*.33 + 4*.33 + 5*.17 = 3.5
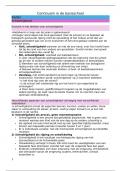
SPREAD
If a distribution needs to be described by a single number, one usually chooses a measure of central tendency
(mean, median …). However, two distributions can have the same mean/median yet look completely different!
RANGE
= difference between max and min score
- 𝐵 = 𝑋[𝑚𝑎𝑥] − 𝑋[𝑚𝑖𝑛]
- This is extremely sensitive to outliers!
INTERQUARTILE RANGE
= difference between third and first quartile
- 𝐼𝑄𝑅 = 𝑄3 − 𝑄1
- This is a more robust measure of spread for quantitative variables
VARIANCE
= average quadratic deviation from the arithmetic average
1
- 𝑆𝑋2 = 𝑛 ∑𝑛𝑖=1(𝑋𝑖 − 𝑋̅ )2
- Can never be negative!
Calculate by
1) Sum to n
2) Calculate 𝑋̅
3) Calculate the deviations (𝑋 − 𝑋̅)
4) Square the deviations
5) Sum these squares
6) Divide by n
STANDARD DEVIATION
= corrects the “squaredness” from the variance to ensure it is expressed in the original unit of measurement
- 𝑆𝑋 = √𝑆𝑋2
- Can never be negative!
LINEAR TRANSFORMATIONS
VARIABLE X VARIABLE X’
𝑋 𝑋 ′ = 𝑎 + 𝑏𝑋
𝑆𝑋2 2
𝑆𝑋′ = 𝑏 2 𝑆𝑋2
𝑆𝑋 𝑆𝑋′ = |𝑏|𝑆𝑋
STANDARDIZING AND Z-SCORES
= transforming a variable such that the average becomes 0 and the standard deviation becomes 1
- Scores on standardized variables are called standard scores or z-scores, which indicate how many standard
deviations you score above or below the average
𝑋𝑖 −𝑋̅
- 𝑧𝑖 = 𝑆𝑋
VARIABLES
= the values we want to measure, e.g. time in seconds, score on a test, gender
- Random variables are variables whose values are unknown and are realizations of a random process
INDEPENDENT VS DEPENDENT VARIABLES
Independent variables Dependent variables
= variable that is not dependent on any other = variable that depends on other factors, the output,
variable, the input, the predictor, the explanation the criteria, the response
- Commonly represented as X1, …, Xj, …, Xk - Commonly represented as Y1, …, Yj, …, Yk
- E.g. the amount of time spent studying - E.g. the exam result
DISCRETE VS CONTINUOUS VARIABLES
Discrete variables Continuous variables
= a variable that only assumes a limited number of = numeric variable that has an infinite number of
values possibilities between two values
- E.g. someone speaks 3 languages, yes/no - E.g. someone looked at a picture for 1,3828 sec
- A discrete variable that - A variable is considered continuous when
• Only assumes two values is a dichotomous • The variable takes on a wide range of values
variable • The variable is a manifestation of an
• Only assumes three values is a underlying continuous variable
trichotomous variable
• Assumes three or more values is a
polytomous variable
QUALITATIVE VS QUANTITATIVE VARIABLES
Qualitative variables Quantitative variables
= numbers only refer to equalities and inequalities = numbers are assigned so that differences between
between the research elements (regarding the numbers correspond with distances between
measured characteristics) research elements (regarding the measured
The number is only a name or label characteristics)
Calculating is not meaningful Number is a real number
Calculating is meaningful
- Nominal variable, e.g. Dutch (1), English (2)
- Ordinal variable, e.g. not satisfied (1) → very - Interval variable, e.g. temperature in °C, Likert-
satisfied (5) scale in numbers
• ! the numbers must be compared by - Ratio variable, e.g. temperature in °K, time
size/order but are not meaningful to
calculate with
There is a hierarchy within the different types of variables:
- While all quantitative variables can be ordinal variables
(seeing as they are numbers and can be ordened), not all
ordinal variables are quantitative variables
- Ordinal variables can be thought of as qualitative variables
where order matters but numerical measurement or
distance between categories doesn’t really matter
,DIS – januari 2025 2
DESCRIBING 1 VARIABLE
TABLES
- Variables are represented by capital letters in
italics in the columns, e.g. X4
- Research elements are located in the rows and
are represented with a Xij formula, with i
referring to the research element and j to the
variable, e.g. X14 = 3
FREQUENCY TABLES
The (absolute) frequency distribution of X is denoted as f(X), e.g. f(X=77) = 3 because the score 77 occurs 3
times
Cumulative frequency of a specific score on X is the total number of scores lower than or equal to that specific
score and its distribution is denoted as F(X), e.g. F(X=77) = 14
- This is not meaningful for qualitative data as the categories are not ordered
Relative frequencies or proportions of scores on X are the frequencies divided by the number of observations
and its distribution is denoted as p(X), e.g. p(X=77) = 3/30 = 0.1
Relative cumulative frequencies or cumulative proportions of a specific score on X equals the cumulative
frequency divided by the total number of observations and its distribution is denoted as P(X), e.g. P(X=77) =
14/30 = 0.47
STEM-AND-LEAF PLOTS
- Read scores by stem.leaf*101, e.g. 8.4*101 = 84
- When looking for a certain percentile and the n is even,
take then average of the two scores, e.g. P50 of n = 30 is
the 15th score, so (78+78)/2 = 78
- When looking for a percentile and matching score is not
in there (e.g. P25 when n = 10), look at the score above
,DIS – januari 2025 3
KEY STATISTICS
PERCENTILES
= score on X under which at least (so lower or equal) a specific % of scores is situated, e.g. 10th percentile
corresponds to score 8 so at least 10% of scores ≤ 8 → P10 = 8
- To calculate, simply find the corresponding score to the % given in the relative cumulative frequency table
• Is the % not literally in the table? Find the smallest higher percentile and take that score
• Is the % literally in the table and n is an even number? Take the median between that one and the one
above
- Special percentiles:
• Quartiles (in 4), with Q1 = P25, Q2 = P50 and Q3 = P75
• Deciles (in 10), with D1 = Pc10, D2 = P20, …
These are all special forms of quantiles or fractiles: a score under which a specific proportion of scores is
situated
Example with Stem-and-leaf plot
CENTER
MODE
= score or category with highest frequency, e.g. 2, 3, 3, 4, 6 → mode = 3
- Can be used for both quantitative and qualitative variables
- Uniqueness?
• Unimodal distribution: mode is uniquely defined
• Bimodal or multimodal distribution: two (or more) scores or categories have the maximum frequency,
e.g. 2, 3, 3, 4, 4, 6 → bimodal: mode = 3 and 4
MEDIAN
= the middle value, so (at least) half of the scores are above it and (at least) half are below it
= Q2 = P50
- Calculate by ordering all observed scores, then taking the middle score or averaging the two middle scores
THE (ARITHMETIC) AVERAGE
1 1
𝑋̅ = 𝑛 ∑𝑛𝑖=1 𝑋𝑖 with ∑𝑛𝑖=1 𝑋𝑖 as the sum of all observed values and 𝑛 as this sum divided by the number of
observed values, e.g. 2, 3, 3, 4, 4, 5 → 𝑋̅ = (2+3+3+4+4+5)/6 = 21/6 = 3.5
, DIS – januari 2025 4
Different formulas for frequency table with k scores with examples:
1
- Using absolute frequencies: 𝑋̅ = 𝑛 ∑𝑘𝑖=1 𝑋𝑖 × 𝑓𝑖 , waarbij ∑𝑘𝑖=1 𝑓𝑖 =
𝑛
e.g. 2, 3, 3, 4, 4, 5 → 𝑋̅ = (2+3x2+4x2+5)/6 = 21/6 = 3.5
- Using relative frequencies: 𝑋̅ = ∑𝑘𝑖=1 𝑋𝑖 × 𝑝𝑖 , waarbij ∑𝑘𝑖=1 𝑝𝑖 = 1
e.g. = 2*.17 + 3*.33 + 4*.33 + 5*.17 = 3.5
SPREAD
If a distribution needs to be described by a single number, one usually chooses a measure of central tendency
(mean, median …). However, two distributions can have the same mean/median yet look completely different!
RANGE
= difference between max and min score
- 𝐵 = 𝑋[𝑚𝑎𝑥] − 𝑋[𝑚𝑖𝑛]
- This is extremely sensitive to outliers!
INTERQUARTILE RANGE
= difference between third and first quartile
- 𝐼𝑄𝑅 = 𝑄3 − 𝑄1
- This is a more robust measure of spread for quantitative variables
VARIANCE
= average quadratic deviation from the arithmetic average
1
- 𝑆𝑋2 = 𝑛 ∑𝑛𝑖=1(𝑋𝑖 − 𝑋̅ )2
- Can never be negative!
Calculate by
1) Sum to n
2) Calculate 𝑋̅
3) Calculate the deviations (𝑋 − 𝑋̅)
4) Square the deviations
5) Sum these squares
6) Divide by n
STANDARD DEVIATION
= corrects the “squaredness” from the variance to ensure it is expressed in the original unit of measurement
- 𝑆𝑋 = √𝑆𝑋2
- Can never be negative!
LINEAR TRANSFORMATIONS
VARIABLE X VARIABLE X’
𝑋 𝑋 ′ = 𝑎 + 𝑏𝑋
𝑆𝑋2 2
𝑆𝑋′ = 𝑏 2 𝑆𝑋2
𝑆𝑋 𝑆𝑋′ = |𝑏|𝑆𝑋
STANDARDIZING AND Z-SCORES
= transforming a variable such that the average becomes 0 and the standard deviation becomes 1
- Scores on standardized variables are called standard scores or z-scores, which indicate how many standard
deviations you score above or below the average
𝑋𝑖 −𝑋̅
- 𝑧𝑖 = 𝑆𝑋