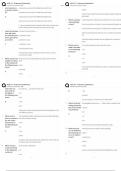
,Fivesstudentssreceivedsthesfollowingstestsscores:s7,s11,s5,s6,sands11.sCalculatesthesmode,smedia
n,smean,sandsrangesofsthissdistributionsofsscores.sWhichsmeasuresofscentralstendencyswoul
dschangesthesmostsifsansadditionalstestsscoresofs2sweresincludedsinsthesdistribution?
Thestableslistssthesscoressofseightsstudentssonsasteststosmeasuresanxiety,sasswellsassthestypicalsnu
mbersofscigarettesseachspersonssmokessdaily.sScoressonsthesanxietystestscansrangesanywher
esfromsaslowsofs0s(indicatingsveryslowsanxiety)stosashighsofs30s(indicatingsveryshighsanxiety)
.
Anxiety Cigarettes
Student TestsScore SmokedsDaily
1 8 11
2 9 3
3 15 11
4 14 16
5 21 26
6 12 10
7 22 24
8 17 18
Constructsasscatterplotstosrepresentsthescorrelationsbetweenssmokingsandsanxiety.sDescribes
thesdirectionsofsthescorrelationsandsgivestwospossiblesexplanationssforsit.
AtsMichigansStatesUniversity,s32sstudentssaresenrolledsinsclasssA,s48sstudentssaresenrolledsin
sclasssB,sands16sstudentssaresenrolledsinsclasssC.sForswhichsofsthesesthreesclassessisstherest
hesgreatestsprobabilitysthatsmoresthans75spercentsofsthesstudentsshavesblondshair?
Explainsyoursanswersandsindicateswhysthissexplanationshassrelevancesforsgeneralizingsap
propriatelysfromssamplesstostheslargerspopulationssinswhichsyousaresinterested.
Pages1
,Answer Key
s
1.
2.
3.
Pages2
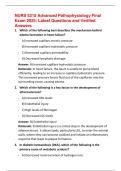
, Thesaveragespricesforsdifferentsbrandssofstoothpastescouldsbesvisuallysdisplayedsinsa(n
)
correlationscoefficient.
scatterplot.
standardsdeviation.
barsgraph.
Whensyousreadsasbarsgraph,sitsissmostsimportantsforsyousto
mentallystransformsthesdatasintosasnormalscurve.
identifysthesvaluesofsthesstandardsdeviation.
notesthesrangesandssizesofsthesscalesvalues.
remembersthatscorrelationsfacilitatessprediction.
Thesmostsfrequentlysoccurringsscoresinsasdistributionsofsscoressissthe
mode.
median.
standardsdeviation.
mean.
Insasgroupsofsfivesindividuals,stwosreportsannualsincomessofs$10,000,sandsthesothersth
reesreportsincomessofs$14,000,s$15,000,sands$31,000,srespectively.sThesmodesofst
hissgroup'ssdistributionsofsannualsincomessis
A) $10,000.
B) $15,000.
C) $16,000.
D) $31,000.
Thesmeansofsasdistributionsofsscoressissthe
mostsfrequentlysoccurringsscore.
arithmeticsaveragesofsallsthesscores.
leastsfrequentlysoccurringsscore.
scoresexceededsbys50spercentsofsallsthesscores.
Whichsmeasuresofscentralstendencysissusedstoscalculatesthesaveragesofsyoursscho
olsgrades?
standardsdeviation
median
mean
mode
Pages1
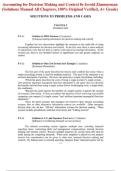
n,smean,sandsrangesofsthissdistributionsofsscores.sWhichsmeasuresofscentralstendencyswoul
dschangesthesmostsifsansadditionalstestsscoresofs2sweresincludedsinsthesdistribution?
Thestableslistssthesscoressofseightsstudentssonsasteststosmeasuresanxiety,sasswellsassthestypicalsnu
mbersofscigarettesseachspersonssmokessdaily.sScoressonsthesanxietystestscansrangesanywher
esfromsaslowsofs0s(indicatingsveryslowsanxiety)stosashighsofs30s(indicatingsveryshighsanxiety)
.
Anxiety Cigarettes
Student TestsScore SmokedsDaily
1 8 11
2 9 3
3 15 11
4 14 16
5 21 26
6 12 10
7 22 24
8 17 18
Constructsasscatterplotstosrepresentsthescorrelationsbetweenssmokingsandsanxiety.sDescribes
thesdirectionsofsthescorrelationsandsgivestwospossiblesexplanationssforsit.
AtsMichigansStatesUniversity,s32sstudentssaresenrolledsinsclasssA,s48sstudentssaresenrolledsin
sclasssB,sands16sstudentssaresenrolledsinsclasssC.sForswhichsofsthesesthreesclassessisstherest
hesgreatestsprobabilitysthatsmoresthans75spercentsofsthesstudentsshavesblondshair?
Explainsyoursanswersandsindicateswhysthissexplanationshassrelevancesforsgeneralizingsap
propriatelysfromssamplesstostheslargerspopulationssinswhichsyousaresinterested.
Pages1
,Answer Key
s
1.
2.
3.
Pages2
, Thesaveragespricesforsdifferentsbrandssofstoothpastescouldsbesvisuallysdisplayedsinsa(n
)
correlationscoefficient.
scatterplot.
standardsdeviation.
barsgraph.
Whensyousreadsasbarsgraph,sitsissmostsimportantsforsyousto
mentallystransformsthesdatasintosasnormalscurve.
identifysthesvaluesofsthesstandardsdeviation.
notesthesrangesandssizesofsthesscalesvalues.
remembersthatscorrelationsfacilitatessprediction.
Thesmostsfrequentlysoccurringsscoresinsasdistributionsofsscoressissthe
mode.
median.
standardsdeviation.
mean.
Insasgroupsofsfivesindividuals,stwosreportsannualsincomessofs$10,000,sandsthesothersth
reesreportsincomessofs$14,000,s$15,000,sands$31,000,srespectively.sThesmodesofst
hissgroup'ssdistributionsofsannualsincomessis
A) $10,000.
B) $15,000.
C) $16,000.
D) $31,000.
Thesmeansofsasdistributionsofsscoressissthe
mostsfrequentlysoccurringsscore.
arithmeticsaveragesofsallsthesscores.
leastsfrequentlysoccurringsscore.
scoresexceededsbys50spercentsofsallsthesscores.
Whichsmeasuresofscentralstendencysissusedstoscalculatesthesaveragesofsyoursscho
olsgrades?
standardsdeviation
median
mean
mode
Pages1