Unit 2.2 DB: Single Subject Design Graph
After reviewing this week’s resources, create a graph using one of the single subject designs.
Post the graph.
Give a brief description of the behavior.
Explain why you chose the design you did.
Describe the results shown in the graph.
Discuss with your classmates how this single subject design can be used in a real world setting.
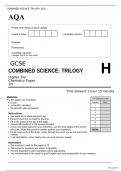
I chose a (line graph) A-B design that measures the consistent number of times the child would disrupt the
class in order to form a baseline of the target behavior occurs. This plot graph measures the baseline
which is the number of times the disruptions occur without the intervention which is the praise. If you
notice that the more days that goes by with the child being praised, the number of disruptions decrease on
a daily basis.
The reason I chose this graph is to clearly show the baseline which is the consistent number the behavior
occurs and increases to give cause to the intervention. The baseline period is categorized as A and the
intervention period is categorized as B. The example clearly shows how the praise decreases the target
behavior which is known as disruptions in class. The horizontal line is referred to as the number of days
that increase and the vertical line shows and is titled for the number of disruptions in the class. Series
1(blue)=Baseline & series 2 (red)= # of disruptions.
Occasionally, a researcher may be focused in labeling a considerable amount of concerns for a single
student or one concern for many students according to Siegle, 2015. In this situation, a multiple-baseline
format is utilized according to Siegle, 2015.
After reviewing this week’s resources, create a graph using one of the single subject designs.
Post the graph.
Give a brief description of the behavior.
Explain why you chose the design you did.
Describe the results shown in the graph.
Discuss with your classmates how this single subject design can be used in a real world setting.
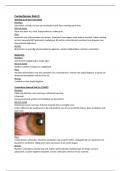
I chose a (line graph) A-B design that measures the consistent number of times the child would disrupt the
class in order to form a baseline of the target behavior occurs. This plot graph measures the baseline
which is the number of times the disruptions occur without the intervention which is the praise. If you
notice that the more days that goes by with the child being praised, the number of disruptions decrease on
a daily basis.
The reason I chose this graph is to clearly show the baseline which is the consistent number the behavior
occurs and increases to give cause to the intervention. The baseline period is categorized as A and the
intervention period is categorized as B. The example clearly shows how the praise decreases the target
behavior which is known as disruptions in class. The horizontal line is referred to as the number of days
that increase and the vertical line shows and is titled for the number of disruptions in the class. Series
1(blue)=Baseline & series 2 (red)= # of disruptions.
Occasionally, a researcher may be focused in labeling a considerable amount of concerns for a single
student or one concern for many students according to Siegle, 2015. In this situation, a multiple-baseline
format is utilized according to Siegle, 2015.