Economie hoorcolleges
Tentamen 1
1 Supply, demand and costs
Supply and demand
What is a market?
Set of buyers and sellers of a good service
o How many buyers, how many sellers?
o Who has the power?
o How big are the sellers?
o Is it easy to enter the market?
Supply and demand
o Buyers - want to buy at a low price
o Sellers - want to sell at a high price
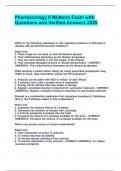
Equilibrium = price quantity
combination at which buyers
and sellers are in agreement =
intersection of supply and
demand
Demand depends on:
Income or wealth
Supply depends on:
Consumer taste
Technology
Prices of substitutes and compliments
Cost of production (labour and
Number of buyers
captial)
Number of suppliers
Producer outside option
These are factors that can shift the demand curve or supply
Othercurve.
(weather)
Elasticity
How sensitive is the demand for a good or a service to changes in the economic
conditions? The slopes of the supply and demand curves determine how markets
respond to shift in supply and demand.
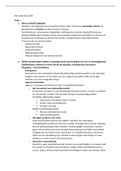
Steep curves: large changes in price and small changes in quantity, all else
equal
Shallow curves: small changes in price and large changes in quantity, all else
equal
Soorten:
Price elasticity of demand: percentage change in
quantity demanded divided by percent change in price
Price elasticity of supply: percentage change in
quantity supplied divided by percent change in price
,Elasticities and linear demand and supply
We often assume demand and supply are linear, so knowing how to calculate the
elasticity of a linear curve is important.
The equation for price elasticity (demand or supply):
Moving up or down a linear supply or demand curve, the ratio delta Q/delta P is equal
to 1/slope; note, the slope is for the inverse supply or demand curve.
Rewriting the formula above:
Costs
Why costs?
Should the firm produce or not?
How much to produce?
How the firm responds to market conditions?
o Expand or contract production?
o Produce something else?
o Close down?
1 Should the firm produce or not?
Types of costs:
Average
variable cost is appropriate cost concept to decide whether to produce at all
Marginal costs are the appropriate cost concept to decide how much to produce
Cost function reflects a couple of key ideas; the production function the firm
faces and the conditions in
input markets (as measured by
input prices)
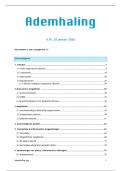
Sunk costs
A sunk cost is like spilt milk: once it is
sunk, there is no use in worrying
, about it, and it should not affect decisions about future actions. In constrast, a fixed
cost that is not sunk (avoidable cost) should influence decisions. If fixed costs are
sunk (incurred whether the firm produces or not), they should be ignored in deciding
whether to produce.
When making decisions we take into account opportunity costs and ignore sunk costs.
Sunk cost fallacy: making the mistake of letting sunk costs affect operating decisions.
Shut down decision
Consider a business deciding whether to close down. Some of the costs associated
with the business are unavoidable (sunk), e.g. permits, loss of value in kitchen
equipment, uniforms. Other costs dissapear when operations cease, e.g. wages for
employees, raw materials, phone bills.
Cost analysis:
A company produces only when income from production is greater than
avoidable costs
When all fixed costs are sunk costs, a company produces when the price is
larger or equal minimum average variable cost.
Important to remember: average variable cost is appropriate cost concept to decide
whether to produce at all.
2 How much to produce?
Important to remember: marginal costs are the
appropriate cost concept to decide how much to
produce
How much to produce?
Economies of scale
What happens to the long-run ATC curve as a
firm grows?
The answer reveals information about
economies in the production process
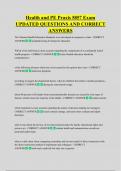
Economies of scale: costs rise more slowly than production
Diseconomies of scale: costs rise more quickly than production
Constant economies of scale: costs rise at the same rate as output
Given these relations, what does the common “U-shape” of the long-run ATC curve
imply for production?
Tentamen 1
1 Supply, demand and costs
Supply and demand
What is a market?
Set of buyers and sellers of a good service
o How many buyers, how many sellers?
o Who has the power?
o How big are the sellers?
o Is it easy to enter the market?
Supply and demand
o Buyers - want to buy at a low price
o Sellers - want to sell at a high price
Equilibrium = price quantity
combination at which buyers
and sellers are in agreement =
intersection of supply and
demand
Demand depends on:
Income or wealth
Supply depends on:
Consumer taste
Technology
Prices of substitutes and compliments
Cost of production (labour and
Number of buyers
captial)
Number of suppliers
Producer outside option
These are factors that can shift the demand curve or supply
Othercurve.
(weather)
Elasticity
How sensitive is the demand for a good or a service to changes in the economic
conditions? The slopes of the supply and demand curves determine how markets
respond to shift in supply and demand.
Steep curves: large changes in price and small changes in quantity, all else
equal
Shallow curves: small changes in price and large changes in quantity, all else
equal
Soorten:
Price elasticity of demand: percentage change in
quantity demanded divided by percent change in price
Price elasticity of supply: percentage change in
quantity supplied divided by percent change in price
,Elasticities and linear demand and supply
We often assume demand and supply are linear, so knowing how to calculate the
elasticity of a linear curve is important.
The equation for price elasticity (demand or supply):
Moving up or down a linear supply or demand curve, the ratio delta Q/delta P is equal
to 1/slope; note, the slope is for the inverse supply or demand curve.
Rewriting the formula above:
Costs
Why costs?
Should the firm produce or not?
How much to produce?
How the firm responds to market conditions?
o Expand or contract production?
o Produce something else?
o Close down?
1 Should the firm produce or not?
Types of costs:
Average
variable cost is appropriate cost concept to decide whether to produce at all
Marginal costs are the appropriate cost concept to decide how much to produce
Cost function reflects a couple of key ideas; the production function the firm
faces and the conditions in
input markets (as measured by
input prices)
Sunk costs
A sunk cost is like spilt milk: once it is
sunk, there is no use in worrying
, about it, and it should not affect decisions about future actions. In constrast, a fixed
cost that is not sunk (avoidable cost) should influence decisions. If fixed costs are
sunk (incurred whether the firm produces or not), they should be ignored in deciding
whether to produce.
When making decisions we take into account opportunity costs and ignore sunk costs.
Sunk cost fallacy: making the mistake of letting sunk costs affect operating decisions.
Shut down decision
Consider a business deciding whether to close down. Some of the costs associated
with the business are unavoidable (sunk), e.g. permits, loss of value in kitchen
equipment, uniforms. Other costs dissapear when operations cease, e.g. wages for
employees, raw materials, phone bills.
Cost analysis:
A company produces only when income from production is greater than
avoidable costs
When all fixed costs are sunk costs, a company produces when the price is
larger or equal minimum average variable cost.
Important to remember: average variable cost is appropriate cost concept to decide
whether to produce at all.
2 How much to produce?
Important to remember: marginal costs are the
appropriate cost concept to decide how much to
produce
How much to produce?
Economies of scale
What happens to the long-run ATC curve as a
firm grows?
The answer reveals information about
economies in the production process
Economies of scale: costs rise more slowly than production
Diseconomies of scale: costs rise more quickly than production
Constant economies of scale: costs rise at the same rate as output
Given these relations, what does the common “U-shape” of the long-run ATC curve
imply for production?