9.1-The circular flow of income
The circular flow of income
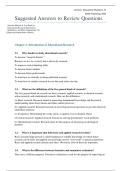
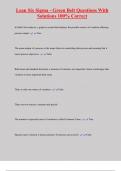
The circular flow of income model shows how income, spending and output move around an
economy. Figure shows the simplest model of the circular flow of income. The model shows
that output generates income which is then spent on the output. This flow explains why GDP can
be measured by calculating the country’s output, income and expenditure.
The difference between an open and a closed economy
An open economy is an economy that takes part in international trade.In contrast, a closed
economy is one that does not export or import goods and services. Of course, no economy is
a totally closed economy but such an economy can be used in a model of how an economy
works.
The circular flow in a closed economy and an open economy
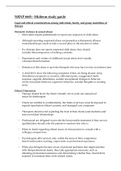
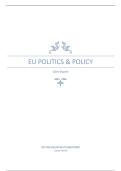
Figure shows the process of circular flow in a closed economy with 2 sectors. The inner circle
shows the real flow of products and factor services and the outer circle the money flow of
spending and incomes
The circular flow of income in a closed economy
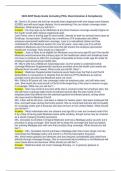
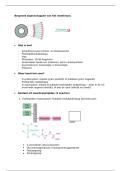
Injections and leakages
, Leakage or Withdrawal refer to those parts of national income that are not used for consumption.
A withdrawal from the circular flow is therefore spending which does not flow back from
household to firms( saving,tax and import expenses). Injections are supplementary expenditure
not originating from the domestic households( government spending, investment and export ).
The impact of injections and leakages on the circular flow
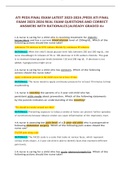
Equilibrium in the circular flow:
In equilibrium, injections are equal to withdrawals. If injections exceed withdrawals, this will
lead to a rise in national income. But as national income rises, so households will not only spend
more on domestic goods (C), but also save more (S), pay more taxes (T) and buy more imports
(M). In other words, withdrawals will rise. This will continue until they have risen to equal
injections. Equilibrium has been reached.
Average propensity to consume (APC):
It measures the ratio between total consumption and total income.( proportion of total
income spend)
APC= C/Y
If income in an economy is $100 thousand and consumption expenditure is $ 80 thousand , find
APC.
Ans:APC= C/Y= 80/100= 0.8
It means 80% of income is spend on consumption in the economy.
Marginal Propensity to consume (MPC):
It is the ratio between change in consumption and change in income.( the proportion of extra
income that is spent)
MPC=Δ C/ΔY
It can also be found by 1 – mps
The circular flow of income
The circular flow of income model shows how income, spending and output move around an
economy. Figure shows the simplest model of the circular flow of income. The model shows
that output generates income which is then spent on the output. This flow explains why GDP can
be measured by calculating the country’s output, income and expenditure.
The difference between an open and a closed economy
An open economy is an economy that takes part in international trade.In contrast, a closed
economy is one that does not export or import goods and services. Of course, no economy is
a totally closed economy but such an economy can be used in a model of how an economy
works.
The circular flow in a closed economy and an open economy
Figure shows the process of circular flow in a closed economy with 2 sectors. The inner circle
shows the real flow of products and factor services and the outer circle the money flow of
spending and incomes
The circular flow of income in a closed economy
Injections and leakages
, Leakage or Withdrawal refer to those parts of national income that are not used for consumption.
A withdrawal from the circular flow is therefore spending which does not flow back from
household to firms( saving,tax and import expenses). Injections are supplementary expenditure
not originating from the domestic households( government spending, investment and export ).
The impact of injections and leakages on the circular flow
Equilibrium in the circular flow:
In equilibrium, injections are equal to withdrawals. If injections exceed withdrawals, this will
lead to a rise in national income. But as national income rises, so households will not only spend
more on domestic goods (C), but also save more (S), pay more taxes (T) and buy more imports
(M). In other words, withdrawals will rise. This will continue until they have risen to equal
injections. Equilibrium has been reached.
Average propensity to consume (APC):
It measures the ratio between total consumption and total income.( proportion of total
income spend)
APC= C/Y
If income in an economy is $100 thousand and consumption expenditure is $ 80 thousand , find
APC.
Ans:APC= C/Y= 80/100= 0.8
It means 80% of income is spend on consumption in the economy.
Marginal Propensity to consume (MPC):
It is the ratio between change in consumption and change in income.( the proportion of extra
income that is spent)
MPC=Δ C/ΔY
It can also be found by 1 – mps