Name: John Atkinson Unit 5 – Learning Aim A Date: 12/06/2019
Data Modelling – Assignment 1
Introduction to the assignment:
In this assignment, I will be investigating the fundamentals of the decision-making process to find
out how using data modelling provides the computational ability to compare consequences and
determine a preferred course of action. Additionally, this will help me to develop myriads of skills
and techniques that are necessary to create complex spreadsheets and I would produce accurate
information that informs decision-making. Therefore, I will first explain the stages in the decision-
making process along with others such as spreadsheet features, considering alternatives, evaluating
models and being able to provide documentation and justifications of the models.
Stages in the decision-making process:
Understanding the scenario:
For the scenario that I was given on the assignment brief, I am asked to investigate data models to
enable the prediction of future sales of the products. In addition, the managers in the company (who
do not have a background in IT) have given me an objective which is to provide a detailed document
to explain the ways spreadsheet models can be used for.
Identifying information and sources:
In this part for the decision-making process, I will be specifying the type of information needed and
knowing where it will come from. Also, I would be ensuring whether my information is reliable.
Furthermore, I will be including all the useful information on my spreadsheet model such as
including the headings on the top and the data underneath each of these along with considering the
profit being made by producing new products.
Also, some information that I need would already be mentioned in the scenario and will be taking
each point required to develop a successful data model without any faults or errors. For instance, I
may be able to identify the number of potential customers or costs involved during the production
of new products.
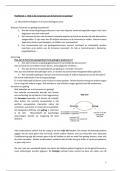
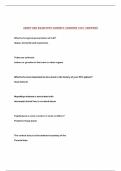
An example of identifying information:
, Name: John Atkinson Unit 5 – Learning Aim A Date: 12/06/2019
This example above demonstrates how the table with data is created by selecting one of the tools
above which would help identify information clearly. This would benefit me as each data will be
inputted to its correct heading as shown underneath which starts from cells “B3 to E5”. Therefore,
providing a relevant spreadsheet data model, every user will know what information is indicated.
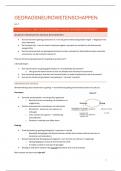
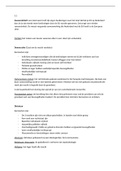
An example of identifying data sources (Microsoft Excel):
This example tells me that it is simply a collection of records that store data. The data source is used
to organize a structure for the receiving program to pull data from.
Additional information:
There may be some extra information to be included in the spreadsheet data model. This useful
information can be indicated by using the source on Microsoft excel. For instance, if I plan a data
model that needs historical weather information for regions in the UK, a download button would
need to be included to direct to its initial UK Met Office website once it has been clicked and this
would provide a wider choice of downloadable data. The other example could be to develop
products by figuring out how much customers will be willing to pay for these products of the forms
of advertising that will be most effective.
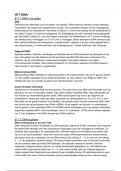
Example of providing a chart display:
Data Modelling – Assignment 1
Introduction to the assignment:
In this assignment, I will be investigating the fundamentals of the decision-making process to find
out how using data modelling provides the computational ability to compare consequences and
determine a preferred course of action. Additionally, this will help me to develop myriads of skills
and techniques that are necessary to create complex spreadsheets and I would produce accurate
information that informs decision-making. Therefore, I will first explain the stages in the decision-
making process along with others such as spreadsheet features, considering alternatives, evaluating
models and being able to provide documentation and justifications of the models.
Stages in the decision-making process:
Understanding the scenario:
For the scenario that I was given on the assignment brief, I am asked to investigate data models to
enable the prediction of future sales of the products. In addition, the managers in the company (who
do not have a background in IT) have given me an objective which is to provide a detailed document
to explain the ways spreadsheet models can be used for.
Identifying information and sources:
In this part for the decision-making process, I will be specifying the type of information needed and
knowing where it will come from. Also, I would be ensuring whether my information is reliable.
Furthermore, I will be including all the useful information on my spreadsheet model such as
including the headings on the top and the data underneath each of these along with considering the
profit being made by producing new products.
Also, some information that I need would already be mentioned in the scenario and will be taking
each point required to develop a successful data model without any faults or errors. For instance, I
may be able to identify the number of potential customers or costs involved during the production
of new products.
An example of identifying information:
, Name: John Atkinson Unit 5 – Learning Aim A Date: 12/06/2019
This example above demonstrates how the table with data is created by selecting one of the tools
above which would help identify information clearly. This would benefit me as each data will be
inputted to its correct heading as shown underneath which starts from cells “B3 to E5”. Therefore,
providing a relevant spreadsheet data model, every user will know what information is indicated.
An example of identifying data sources (Microsoft Excel):
This example tells me that it is simply a collection of records that store data. The data source is used
to organize a structure for the receiving program to pull data from.
Additional information:
There may be some extra information to be included in the spreadsheet data model. This useful
information can be indicated by using the source on Microsoft excel. For instance, if I plan a data
model that needs historical weather information for regions in the UK, a download button would
need to be included to direct to its initial UK Met Office website once it has been clicked and this
would provide a wider choice of downloadable data. The other example could be to develop
products by figuring out how much customers will be willing to pay for these products of the forms
of advertising that will be most effective.
Example of providing a chart display: