Chapter 31: Business Cycles
Short-run fluctuations are more obviously felt by most people. Over time, economies
fluctuate between periods of relative stability with economic growth, falling unemployment,
and inflation at relatively low and stable levels, and periods where economic growth declines
and unemployment rises. These periods of expansion and slowdown are referred to as the
business cycle. Economists wanted to investigate why economic variables moved together
in times of economic slowdown; they defined a recession as characterized by a period of
falling incomes and rising unemployment, which occurs after two successive quarters of
negative growth. If such a contraction in growth continues and is more severe it might be
described as a depression. Business cycles can be analyzed by looking at periods of
economic growth and identifying peaks and troughs in an activity where each represents
turning points. A peak occurs when output, employment, retail sales or manufacturing
production, begin to decline together. A trough refers to the time when these economic
variables begin to rise. Some variables, such as employment, may not change at the same
time as others and are regarded as lagging indicators.
Trend Growth Rates
Most of the data we will be looking at in this chapter is classed as time-series data,
observations on a variable over a time period and which are ordered over time. Central to
the analysis of business cycles is GDP over time.
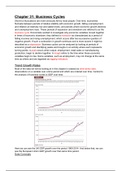
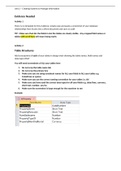
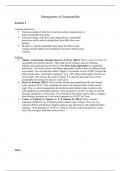
Here we can see the UK GDP growth over the period 1960-2014. And below that, we can
see the European Union GDP growth over that same time period.
Data Concepts
Short-run fluctuations are more obviously felt by most people. Over time, economies
fluctuate between periods of relative stability with economic growth, falling unemployment,
and inflation at relatively low and stable levels, and periods where economic growth declines
and unemployment rises. These periods of expansion and slowdown are referred to as the
business cycle. Economists wanted to investigate why economic variables moved together
in times of economic slowdown; they defined a recession as characterized by a period of
falling incomes and rising unemployment, which occurs after two successive quarters of
negative growth. If such a contraction in growth continues and is more severe it might be
described as a depression. Business cycles can be analyzed by looking at periods of
economic growth and identifying peaks and troughs in an activity where each represents
turning points. A peak occurs when output, employment, retail sales or manufacturing
production, begin to decline together. A trough refers to the time when these economic
variables begin to rise. Some variables, such as employment, may not change at the same
time as others and are regarded as lagging indicators.
Trend Growth Rates
Most of the data we will be looking at in this chapter is classed as time-series data,
observations on a variable over a time period and which are ordered over time. Central to
the analysis of business cycles is GDP over time.
Here we can see the UK GDP growth over the period 1960-2014. And below that, we can
see the European Union GDP growth over that same time period.
Data Concepts