Statistics year 1 overview
Lecture 1 Keller ch1, ch2, ch3
Population Set of all items of interest in a statistical problem
Paremeters Descriptive measures of population
- Mean
- Standard deviation
Sample Set drawn from population
Statistics Descriptive measure of a sample
- Mean x̄
- Standard deviation s
Statistical concepts 1. Descriptive
2. Inferential
1. Descriptive statistics Presenting and summarizing data in an effective way:
- Tables & graphical tools
- Nummerical summary (mean, mode, median,
standard deviation)
2. Inferential Drawing conclusions about an unknown population
(parameters) based on samples (statistics)
Variable Characteristic of interest to us, they may either be
qualitative or quantitative
1. Qualitative Outcomes are categorial:
- Nominal: mutually exclusive categories, name
giving
o E.g. Country of origin
Pie or bar chart
- Ordinal: natural ordering, ranking, able to
compare
o E.g. Preferences cola
Histograms
2. Quantitative Outcomes are numerical:
- Interval: natural distance
o E.g. Shoe size
- Ratio: absolute zero point
o E.g. Age, weight, height
(these 2 are combined in the Keller book)
Frequency tables and histograms Descriptive techniques for quantitative data
Frequency table Overview that classifies the data into non overlapping
Quantitative data classes or intervals and counts the number of
observations in each class
Bin Upper class
Frequency distribution Class width:
Quantitative data Range (largest - smallest) / # classes
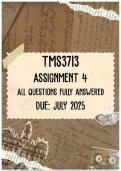
Histograms shapes 1. Symmetry: observations are in balance
Quantitative data 2. Skewness: tale to the right or left
3. Bell shaped: normally distributed
,Modal class The class with the largest number of observations:
Quantitative data 1. Unimodal: 1 modal class
2. Bimodal: 2 modal classes (2 peaks)
Ogives Graphical representation of cumulative frequency
Quantitative data distribution
Stem and leaf display Graphical technique that is often used in a preliminary
Quantitative data analysis, alternative for a histogram. Show values of
original observations whereas histogram loses them
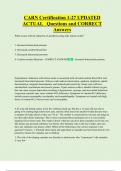
Pie and Bar charts Descriptive techniques for qualitative data (nominal
Qualitative data and ordinal)
Pie chart Emphasize proportion of occurrence of the categories
Qualitative data - Mostly used by nominal data
Bar chart Emphasize frequency of occurrence of the categories
Qualitative data (bars are separated)
- Mostly used by ordinal data
Describing times series data Data can be classified according to the time they are
measured:
- Cross-sectional data: all collected at the same
time
- Time-series: all data is collected at successive
points = often depicted on a line chart
Graphical excellence and Excellent graphical techniques are informative and
deception concise, and provide a clear presentation of the data
, Lecture 2 Keller Ch 4
3 types of summary measures 1. Measures of central location
2. Measures of spread
3. Measures of relative standing // non central
location
1. Measures of central location - Mean
- Median
- Mode
2. Measures of non central - Quantiles
location - Percentiles
3. Measures of variability - Range
- Variance
- Standard deviation
- Coefficient of variation
- Interquartile range
Measures of central location Aim: describe most typical outcome of distribution
- Mean (arithmetic) Sum of all observation/number of observations
- Sample mean
- Standard deviation
- Median The value that falls in the middle when the
measurements are arranged in order of magnitude
Less sensitive for extreme observations
Quantitative data
- Mode The value that occurs most frequently
Qualitative and quantitative
Possible to have multiple modes
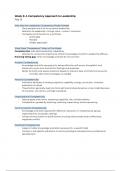
Symmetrical The mean, median and mode coincide
distribution/unimodal
Non symmetrical and skewed The three measures differ
Left: mean, median, mode
Right: mode, median, mean
- Geometric mean A measure of average growth
Two steps:
1. (1+Rg)n = (1+R1) + (1+R2) … (1+Rn)
2. Rg = n(1+R1) + (1+R2) … (1+Rn) - 1
Measures of variability Aim: summarize degree of variability of outcomes
around the mean, indication of how typical the mean
value is for all outcomes
- Range The difference between the largest and the smallest
observation
very sensitive for extreme values
- Variance Reflects the values of all the measurements
Sample variance:
Population variance:
- Standard deviation The square root of the variance of the measurements
Lecture 1 Keller ch1, ch2, ch3
Population Set of all items of interest in a statistical problem
Paremeters Descriptive measures of population
- Mean
- Standard deviation
Sample Set drawn from population
Statistics Descriptive measure of a sample
- Mean x̄
- Standard deviation s
Statistical concepts 1. Descriptive
2. Inferential
1. Descriptive statistics Presenting and summarizing data in an effective way:
- Tables & graphical tools
- Nummerical summary (mean, mode, median,
standard deviation)
2. Inferential Drawing conclusions about an unknown population
(parameters) based on samples (statistics)
Variable Characteristic of interest to us, they may either be
qualitative or quantitative
1. Qualitative Outcomes are categorial:
- Nominal: mutually exclusive categories, name
giving
o E.g. Country of origin
Pie or bar chart
- Ordinal: natural ordering, ranking, able to
compare
o E.g. Preferences cola
Histograms
2. Quantitative Outcomes are numerical:
- Interval: natural distance
o E.g. Shoe size
- Ratio: absolute zero point
o E.g. Age, weight, height
(these 2 are combined in the Keller book)
Frequency tables and histograms Descriptive techniques for quantitative data
Frequency table Overview that classifies the data into non overlapping
Quantitative data classes or intervals and counts the number of
observations in each class
Bin Upper class
Frequency distribution Class width:
Quantitative data Range (largest - smallest) / # classes
Histograms shapes 1. Symmetry: observations are in balance
Quantitative data 2. Skewness: tale to the right or left
3. Bell shaped: normally distributed
,Modal class The class with the largest number of observations:
Quantitative data 1. Unimodal: 1 modal class
2. Bimodal: 2 modal classes (2 peaks)
Ogives Graphical representation of cumulative frequency
Quantitative data distribution
Stem and leaf display Graphical technique that is often used in a preliminary
Quantitative data analysis, alternative for a histogram. Show values of
original observations whereas histogram loses them
Pie and Bar charts Descriptive techniques for qualitative data (nominal
Qualitative data and ordinal)
Pie chart Emphasize proportion of occurrence of the categories
Qualitative data - Mostly used by nominal data
Bar chart Emphasize frequency of occurrence of the categories
Qualitative data (bars are separated)
- Mostly used by ordinal data
Describing times series data Data can be classified according to the time they are
measured:
- Cross-sectional data: all collected at the same
time
- Time-series: all data is collected at successive
points = often depicted on a line chart
Graphical excellence and Excellent graphical techniques are informative and
deception concise, and provide a clear presentation of the data
, Lecture 2 Keller Ch 4
3 types of summary measures 1. Measures of central location
2. Measures of spread
3. Measures of relative standing // non central
location
1. Measures of central location - Mean
- Median
- Mode
2. Measures of non central - Quantiles
location - Percentiles
3. Measures of variability - Range
- Variance
- Standard deviation
- Coefficient of variation
- Interquartile range
Measures of central location Aim: describe most typical outcome of distribution
- Mean (arithmetic) Sum of all observation/number of observations
- Sample mean
- Standard deviation
- Median The value that falls in the middle when the
measurements are arranged in order of magnitude
Less sensitive for extreme observations
Quantitative data
- Mode The value that occurs most frequently
Qualitative and quantitative
Possible to have multiple modes
Symmetrical The mean, median and mode coincide
distribution/unimodal
Non symmetrical and skewed The three measures differ
Left: mean, median, mode
Right: mode, median, mean
- Geometric mean A measure of average growth
Two steps:
1. (1+Rg)n = (1+R1) + (1+R2) … (1+Rn)
2. Rg = n(1+R1) + (1+R2) … (1+Rn) - 1
Measures of variability Aim: summarize degree of variability of outcomes
around the mean, indication of how typical the mean
value is for all outcomes
- Range The difference between the largest and the smallest
observation
very sensitive for extreme values
- Variance Reflects the values of all the measurements
Sample variance:
Population variance:
- Standard deviation The square root of the variance of the measurements