Summary Ecological Methods
1.
Introduction
Mean
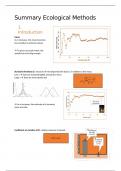
As n increases, the mean becomes
less sensitive to extreme values.
To get an accurate mean, the
sample has to be big enough.
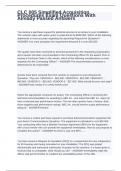
Standard deviation (s): measure of how dispersed the data is, in relation to the mean.
Low s data are clustered tightly around the mean
√
Large s data are more spread out
s=
∑ ( x− x̄)2
n−1
As n increases, the estimate of s becomes
more accurate
Coefficient of variation (CV): relative measure of spread
CV =s/ x̄
, Order of data-analysis in R:
1. Read and inspect
2. Set independent variables as factor
3. Make a histogram
4. Make a summary table
5. Make a bar graph + error bar
3 levels of measurements:
1. Nominal: identifies categories (e.g. habitat, sex, colour, species)
2. Ordinal: identifies an order (abundant, frequent, occasional, rare)
3. Scale (ratio scale):
- Has an absolute zero (weight, length, intake, growth)
- Subtract, add, multiplication, division
1.1. Distribution types
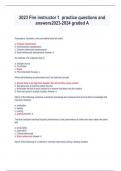
Normal distribution Symmetric & continuous
Lognormal distribution Skewed & continuous
exponential growth, biomass,
concentrations
4. Mean not in the middle
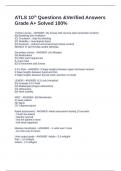
,Poisson distribution Skewed, not continuous: discrete,
Negative Binomial distribution counts (e.g. quadrats)
Binomial distribution Two outcomes:
- dead/alive
- present/absent
- smoking/not smoking
Not continuous, discrete
, 2. T-tests
Hypothesis: a testable explanation of an observation
- Not just an educated guess
- Must be testable and well-justified
- Clear direction:
1. Larger/smaller
2. Decrease/increase
A hypothesis is based on:
- Observations
- Facts that already have been proven true
If …, then …, because …
E.g.:
If I fertilize an area (x)
then the grysbok will have a larger body weight (y)
because of the higher food quality intake.
2 types of variables:
- Independent variable: cause (x)
- Dependent variable: effect (y)
H0 = Null hypothesis most conservative approach; there is no effect
H1 = Alternative hypothesis (prediction) prediction that is being tested to be true
Hypothesis are being tested, by looking at the mean of the
ratio scale variable.
the higher the n, the more accurate the mean. Which can
be seen by the standard error of the mean.
Standard error (SE) of the mean: measure of precision of
sample means
SE=s / √ n
Larger n smaller SE
1.
Introduction
Mean
As n increases, the mean becomes
less sensitive to extreme values.
To get an accurate mean, the
sample has to be big enough.
Standard deviation (s): measure of how dispersed the data is, in relation to the mean.
Low s data are clustered tightly around the mean
√
Large s data are more spread out
s=
∑ ( x− x̄)2
n−1
As n increases, the estimate of s becomes
more accurate
Coefficient of variation (CV): relative measure of spread
CV =s/ x̄
, Order of data-analysis in R:
1. Read and inspect
2. Set independent variables as factor
3. Make a histogram
4. Make a summary table
5. Make a bar graph + error bar
3 levels of measurements:
1. Nominal: identifies categories (e.g. habitat, sex, colour, species)
2. Ordinal: identifies an order (abundant, frequent, occasional, rare)
3. Scale (ratio scale):
- Has an absolute zero (weight, length, intake, growth)
- Subtract, add, multiplication, division
1.1. Distribution types
Normal distribution Symmetric & continuous
Lognormal distribution Skewed & continuous
exponential growth, biomass,
concentrations
4. Mean not in the middle
,Poisson distribution Skewed, not continuous: discrete,
Negative Binomial distribution counts (e.g. quadrats)
Binomial distribution Two outcomes:
- dead/alive
- present/absent
- smoking/not smoking
Not continuous, discrete
, 2. T-tests
Hypothesis: a testable explanation of an observation
- Not just an educated guess
- Must be testable and well-justified
- Clear direction:
1. Larger/smaller
2. Decrease/increase
A hypothesis is based on:
- Observations
- Facts that already have been proven true
If …, then …, because …
E.g.:
If I fertilize an area (x)
then the grysbok will have a larger body weight (y)
because of the higher food quality intake.
2 types of variables:
- Independent variable: cause (x)
- Dependent variable: effect (y)
H0 = Null hypothesis most conservative approach; there is no effect
H1 = Alternative hypothesis (prediction) prediction that is being tested to be true
Hypothesis are being tested, by looking at the mean of the
ratio scale variable.
the higher the n, the more accurate the mean. Which can
be seen by the standard error of the mean.
Standard error (SE) of the mean: measure of precision of
sample means
SE=s / √ n
Larger n smaller SE