Assignment 5: Machine Learning (Weka)
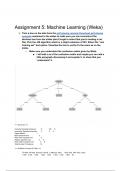
➢ Train a tree on the data from the golf playing example Download golf playing
example mentioned in the slides to make sure you can reconstruct the
decision tree from the slides (don't forget to select that you're loading a csv
file). Pick the J48 algorithm which is a slight extension of ID3. Select the “use
training set” test option. Visualise the tree to verify it's the same as on the
slides.
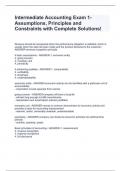
○ Make sure you understand the confusion matrix given by Weka.
■ I will add a ss of the confusion matrix and maybe you can add a
little paragraph discussing it and explain it, to show that you
‘understand’ it.
=== Summary ===
Correctly Classified Instances 14 100 %
Incorrectly Classified Instances 0 0 %
Kappa statistic 1
Mean absolute error 0
Root mean squared error 0
Relative absolute error 0 %
Root relative squared error 0 %
Total Number of Instances 14
=== Detailed Accuracy By Class ===
TP Rate FP Rate Precision Recall F-Measure MCC ROC Area PRC Area Class
1,000 0,000 1,000 1,000 1,000 1,000 1,000 1,000 No
, 1,000 0,000 1,000 1,000 1,000 1,000 1,000 1,000 Yes
Weighted Avg. 1,000 0,000 1,000 1,000 1,000 1,000 1,000 1,000
=== Confusion Matrix ===
a b <-- classified as
5 0 | a = No
0 9 | b = Yes
A confusion matrix is used in classification problems to evaluate the effectiveness of a machine
learning model. It compares the predicted classifications to the actual classifications, allowing us to
see how well the model is performing.
➢ Accuracy: The proportion of correctly classified instances out of the total.
(5+9) / (5+0+0+9) = 14/14 = 100%.
➢ Precision: The proportion of true positives out of the total predicted positives.
For class "Yes", it is 9 / (9+0) = 100%.
➢ Recall (Sensitivity or True Positive Rate): The proportion of true positives out of the actual
positives.
For class "Yes", it is 9 / (9+0) = 100%.
➢ Specificity (True Negative Rate): The proportion of true negatives out of the actual negatives.
For class "No", it is 5 / (5+0) = 100%.
The confusion matrix shows that the classifier has performed perfectly on the given dataset,
correctly classifying all instances without any errors.
➢ Use the medical heart example data Download medical heart example data to
train a decision tree. Again, visualise the tree.
Material to hand in:
○ A screenshot of your decision tree.
, === Run information ===
Scheme: weka.classifiers.trees.J48 -C 0.25 -M 2
Relation: heart
Instances: 918
Attributes: 12
Age
Sex
ChestPainType
RestingBP
Cholesterol
FastingBS
RestingECG
MaxHR
ExerciseAngina
Oldpeak
ST_Slope
HeartDisease
Test mode: evaluate on training data
=== Classifier model (full training set) ===
J48 pruned tree
------------------
ST_Slope = Up
| Cholesterol <= 0
| | FastingBS <= 0
➢ Train a tree on the data from the golf playing example Download golf playing
example mentioned in the slides to make sure you can reconstruct the
decision tree from the slides (don't forget to select that you're loading a csv
file). Pick the J48 algorithm which is a slight extension of ID3. Select the “use
training set” test option. Visualise the tree to verify it's the same as on the
slides.
○ Make sure you understand the confusion matrix given by Weka.
■ I will add a ss of the confusion matrix and maybe you can add a
little paragraph discussing it and explain it, to show that you
‘understand’ it.
=== Summary ===
Correctly Classified Instances 14 100 %
Incorrectly Classified Instances 0 0 %
Kappa statistic 1
Mean absolute error 0
Root mean squared error 0
Relative absolute error 0 %
Root relative squared error 0 %
Total Number of Instances 14
=== Detailed Accuracy By Class ===
TP Rate FP Rate Precision Recall F-Measure MCC ROC Area PRC Area Class
1,000 0,000 1,000 1,000 1,000 1,000 1,000 1,000 No
, 1,000 0,000 1,000 1,000 1,000 1,000 1,000 1,000 Yes
Weighted Avg. 1,000 0,000 1,000 1,000 1,000 1,000 1,000 1,000
=== Confusion Matrix ===
a b <-- classified as
5 0 | a = No
0 9 | b = Yes
A confusion matrix is used in classification problems to evaluate the effectiveness of a machine
learning model. It compares the predicted classifications to the actual classifications, allowing us to
see how well the model is performing.
➢ Accuracy: The proportion of correctly classified instances out of the total.
(5+9) / (5+0+0+9) = 14/14 = 100%.
➢ Precision: The proportion of true positives out of the total predicted positives.
For class "Yes", it is 9 / (9+0) = 100%.
➢ Recall (Sensitivity or True Positive Rate): The proportion of true positives out of the actual
positives.
For class "Yes", it is 9 / (9+0) = 100%.
➢ Specificity (True Negative Rate): The proportion of true negatives out of the actual negatives.
For class "No", it is 5 / (5+0) = 100%.
The confusion matrix shows that the classifier has performed perfectly on the given dataset,
correctly classifying all instances without any errors.
➢ Use the medical heart example data Download medical heart example data to
train a decision tree. Again, visualise the tree.
Material to hand in:
○ A screenshot of your decision tree.
, === Run information ===
Scheme: weka.classifiers.trees.J48 -C 0.25 -M 2
Relation: heart
Instances: 918
Attributes: 12
Age
Sex
ChestPainType
RestingBP
Cholesterol
FastingBS
RestingECG
MaxHR
ExerciseAngina
Oldpeak
ST_Slope
HeartDisease
Test mode: evaluate on training data
=== Classifier model (full training set) ===
J48 pruned tree
------------------
ST_Slope = Up
| Cholesterol <= 0
| | FastingBS <= 0