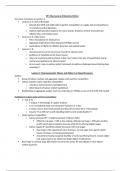
Type Test One/Two Sided H0 vs H1 Test Statistic Critic. Value SPSS Reject H0 if Calculate P-value
t(α;n−k−1)α;n−k−1)n−k−1) (α;n−k−1)Reject if p-value<
α.))
One-sided H0:βj ≤ b vs H1:βj> IDF.T(1-alpha, Val ≥ t(α;n−k−1)n−k−1) 1-CDF.T(val, n-
upper tail test: b. T = (Bj – b) / SBj n-k-1) k-1)
T - Test One-sided
lower tail test
H0: βj≥ b vs H1:βj <
b
IDF.T(alpha, n-k-
1)
Val ≤ t(α;n−k−1)n−k−1) CDF.T(val, n-k-
1)
Two-sided H0: βj=b vs H1: βj IDF.T(1-alpha/2, |val|≥ t 2*(1-
=/ b n-k-1) (α/2;n−k−1)n−k−1) CDF.T(ABS(val)
, n-k-1))
H0: β1=β2=··· = βk= F= (SST−SSE)/k) / IDF.F(1-alpha, k, Val ≥ 1-CDF.F(val, k,
F -Test X 0 (SSE / (n−k−1)) n-k-1) Fα;n−k−1)k;n−k−1)n−k−1. n-k-1)
H1: At least one of
βj/= 0 for j= 1,...,k
H0: F=((SSEr−SSEc)/ IDF.F(1-alpha, k- Val ≥ 1-CDF.F(val, k-
Partial X βg+1=βg+2=···=βk= (k−g)) / (SSEc(n−k−1)) g, n-k-1) Fα;n−k−1)k−g;n−k−1)n−k−1. g, n-k-1)
0
F - Test H1: At least one of
βj/= 0 for j=g+ 1,...,k
T – Test:
You can read the Val of the test statistic directly from SPSS only if the hinge b= 0. If b/= 0, you must calculate the val by hand/calculator using the estimated coefficient and
standard error.
F – Test:
• You can use the value under F in the ANOVA table in SPSS to find the Val of the F-Test.
• You can use the value under “Sig.” in the ANOVA table in SPSS to find the p-value of the F-Test.
Partial F-Test:
• The full model has k variables and the reduced model has g variables, where g < k.
• It is possible to compute the Val and the associated p-value in SPSS for partial F-tests: Analyze → Regression → Linear → Place Y variable in dependent box. →Place all k
variables (the complete model) in the Independent box.→ Press Next → Add the variables you want to remove in the Block 2 of
2box→ChangeMethodtoRemove.→ClickStatistics→ Tick R squared change →Click Continue and OK. The Val can be found under “Model Summary”, the 2nd row in the
column “F Change. The associated p-value is the 2nd row in the column “Sig. F Change”
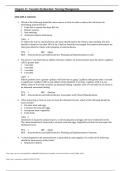