9/10/24, 4:16 PM Pesticide vs IPM Case Studies
Part 1: Pesticide Spraying Case Study
An insect pest has attacked about 20 percent
of the trees in a pure stand of white pine. In
an effort to reduce his economic loss, the
owner has his forest crop sprayed each spring
with a relatively new pesticide.
The species that he is trying to eliminate is
normally preyed upon by other insects, a
parasite, and song birds from nearby woods.
To the south of his property is a bird
sanctuary for rare species of waterfowl and
the carnivorous osprey.
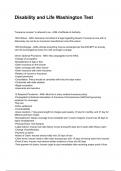
He has been assured that natural barriers and
the wind direction will keep the pesticide out
of the wildlife area. The three areas shown on
the diagram (Figure 1) were carefully studied
over a five-year period by researchers from a
nearby university.
Insect populations were estimated, fish and
bird populations studied, soil samples
collected, and pesticide concentrations
measured in an effort to determine the
overall environmental influence of this new
pesticide. The results are recorded in Table 1.
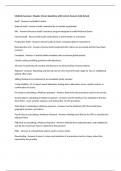
1. Plot a graph which shows the changes over time of the population of insect pests in each area: A, B and C.
about:blank 1/5
, 9/10/24, 4:16 PM Pesticide vs IPM Case Studies
a. Why did the population of pests in Area A increase in 1978 when, in 1977, it appeared that the pest had
been almost completely eliminated?
The population of pests in Area A increased in 1978 though it had appeared that the pest had been
almost eliminated, because of the introduction of the new pesticide. The pest may have had some of its
population survive as they gained resistance to the pesticide which would increase their population later.
b. What indication is there that Area C has not been directly affected by the aerial spraying of the
pesticide?
There was no drastic change in the population of pests in Area C as the population stayed between
40000 and 50000, which indicates that Area C was not directly affected by the pesticide like Area A was.
2. Discuss the effect that the pesticide had on natural pest controls in each area.
a. Which categories would be considered natural pest controls?
Predators of pests like insects and parasites.
b. How did this eventually influence the size of the population?
The decrease of insect predators and the percentage of pests with parasites influenced the size of the
population by leading to the size growth of the insect population.
3. Consider the effect that the pesticide had on fish and bird species.
a. Why is the concentration of pesticide so high in fish and bird species?
Since the pesticide also resulted in the contamination of water, the fish were affected as their habitat
was now contaminated. The birds consumed insects that were affected by pesticides which led to the
high concentration in their species.
b. What change in the concentrations of pesticide in the fish and bird life represent the point where
significant change in mortality occurs?
In 1976, when the insecticide in the bird eggs increased from 70ppm to 170ppm, the nesting success for
the birds dropped significantly from 80% to 25%. For the fish, in 1977, when the pesticide concentration
rose above 150ppm, their mortality rate increased from 10% in Areas A and B to 50% in Area A and
40% in Area B.
c. Suggest a food chain that would link the pine stand vegetation to the poor nesting success of the birds.
Pine stand vegetation->Insect pests->Songbirds
4. What method(s) could be used to remedy this “eco-mess”?
To remedy the “eco-mass” integrated pest management practices could be used.
5. How did the use of this pesticide affect species diversity and therefore environmental stability?
The pesticide affected species diversity and therefore environmental stability by almost causing an extinction of
the birds, parasites, and fish in Areas A and B. This near extinction resulted in a decrease in biodiversity and
therefore a decrease of environmental stability.
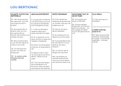
Table 1: Pesticide Spraying Results
Species of % of pests % fish Pesticide % Insecticide
Insect pest
Year Area insect with mortality concentration nesting in eggs
population
predators parasites (adults) in fish (ppm) success (ppm)
A 200,000 4 50 10 50
1975 B 50,000 7 30 10 50 80 70
C 50,000 8 30 8 30
A 4,000 2 10 10 150
1976 25 170
B 2,000 3 20 10 120
about:blank 2/5
Part 1: Pesticide Spraying Case Study
An insect pest has attacked about 20 percent
of the trees in a pure stand of white pine. In
an effort to reduce his economic loss, the
owner has his forest crop sprayed each spring
with a relatively new pesticide.
The species that he is trying to eliminate is
normally preyed upon by other insects, a
parasite, and song birds from nearby woods.
To the south of his property is a bird
sanctuary for rare species of waterfowl and
the carnivorous osprey.
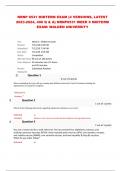
He has been assured that natural barriers and
the wind direction will keep the pesticide out
of the wildlife area. The three areas shown on
the diagram (Figure 1) were carefully studied
over a five-year period by researchers from a
nearby university.
Insect populations were estimated, fish and
bird populations studied, soil samples
collected, and pesticide concentrations
measured in an effort to determine the
overall environmental influence of this new
pesticide. The results are recorded in Table 1.
1. Plot a graph which shows the changes over time of the population of insect pests in each area: A, B and C.
about:blank 1/5
, 9/10/24, 4:16 PM Pesticide vs IPM Case Studies
a. Why did the population of pests in Area A increase in 1978 when, in 1977, it appeared that the pest had
been almost completely eliminated?
The population of pests in Area A increased in 1978 though it had appeared that the pest had been
almost eliminated, because of the introduction of the new pesticide. The pest may have had some of its
population survive as they gained resistance to the pesticide which would increase their population later.
b. What indication is there that Area C has not been directly affected by the aerial spraying of the
pesticide?
There was no drastic change in the population of pests in Area C as the population stayed between
40000 and 50000, which indicates that Area C was not directly affected by the pesticide like Area A was.
2. Discuss the effect that the pesticide had on natural pest controls in each area.
a. Which categories would be considered natural pest controls?
Predators of pests like insects and parasites.
b. How did this eventually influence the size of the population?
The decrease of insect predators and the percentage of pests with parasites influenced the size of the
population by leading to the size growth of the insect population.
3. Consider the effect that the pesticide had on fish and bird species.
a. Why is the concentration of pesticide so high in fish and bird species?
Since the pesticide also resulted in the contamination of water, the fish were affected as their habitat
was now contaminated. The birds consumed insects that were affected by pesticides which led to the
high concentration in their species.
b. What change in the concentrations of pesticide in the fish and bird life represent the point where
significant change in mortality occurs?
In 1976, when the insecticide in the bird eggs increased from 70ppm to 170ppm, the nesting success for
the birds dropped significantly from 80% to 25%. For the fish, in 1977, when the pesticide concentration
rose above 150ppm, their mortality rate increased from 10% in Areas A and B to 50% in Area A and
40% in Area B.
c. Suggest a food chain that would link the pine stand vegetation to the poor nesting success of the birds.
Pine stand vegetation->Insect pests->Songbirds
4. What method(s) could be used to remedy this “eco-mess”?
To remedy the “eco-mass” integrated pest management practices could be used.
5. How did the use of this pesticide affect species diversity and therefore environmental stability?
The pesticide affected species diversity and therefore environmental stability by almost causing an extinction of
the birds, parasites, and fish in Areas A and B. This near extinction resulted in a decrease in biodiversity and
therefore a decrease of environmental stability.
Table 1: Pesticide Spraying Results
Species of % of pests % fish Pesticide % Insecticide
Insect pest
Year Area insect with mortality concentration nesting in eggs
population
predators parasites (adults) in fish (ppm) success (ppm)
A 200,000 4 50 10 50
1975 B 50,000 7 30 10 50 80 70
C 50,000 8 30 8 30
A 4,000 2 10 10 150
1976 25 170
B 2,000 3 20 10 120
about:blank 2/5