Lecture 1- Introduction
Marketing Strategy Research
• Based on Consumer Marketing Research you can get to know the consumers
through data about them.
• The data analytics about consumers can be used in tools to create a marketing
strategy.
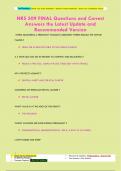
Linking tools to marketing strategy
• Linear regression → Market responses (e.g. pricing)
• Conjoint analysis→ New Product Design
• Bass Model→ New Product Diffusion
• Cluster Analysis→ Segmentation
• Multi-dimensional Scaling → Positioning
Principles of data-driven marketing
The principles are generic and applicable to almost all data-driven marketing situations.
• Principle 1: Any statistical analysis is to reduce information loss
• Principle 2: Causation cannot be learnt directly from data
• Principle 3: Prediction doesn’t care about statistical significance
• Principle 4: Practical usefulness triumphs statistical criteria
,Lecture 2- Market Response Model
Market Response Model: How to predict market response?
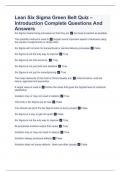
Description of a prediction machine
• Process: Data is gathered and put into the prediction machine with the objective of
finding a functional relationship between input and output. The output then is a
prediction.
• Objective: To find a functional relationship between input and output
• The prediction machine can take many forms and the functional relationship can take
many different forms. Often some deep learning is included.
Example of a prediction machine:
Linear regression to predict market response
A linear regression is one way to predict market response.
A linear regression represents y= a + bx
,Example toy: Starting from scratch- A simple linear regression
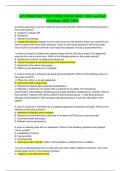
Scatter plot of price VS sales:
To start with, a scatter plot is created from all data points to start looking at the relationship
between price and sales.
Relationship:
The objective is to fit the relationship to a line:
Sales= a + bPrice
• a is the intercept
• b is the slope/coefficients
→ But how to draw the
line?
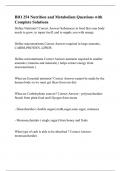
How to draw the line?
• What is a good prediction? → Principle: Any statistical analysis is to reduce
information loss (when going from observations to predictions).
, • Choose a line that minimizes the differences
5-step framework for a linear regression
A framework for conducting regression analysis in 5 steps:
Step 1: Examining the data
Detecting multicollinearity:
Sales= a + b1Price + b2Price
• Multicollinearity= When multiple independent variables contain the same
information or are highly correlated → Leads to biased and misleading estimated
coefficients.
How to detect multi-collinearity?
• Use the VIF function:
- VIF below 10: Not an issue
- VIF above 10: High collinearity
How to deal with multicollinearity?
• Use only one of the two variables in your regression
• Transform the correlated variables into a mutually independent set of predictors
(e.g. factor analysis). Downside: Difficult to interpret
• Collect more data
Step 2: Formulating the model
To decide which variables to use as input:
Marketing Strategy Research
• Based on Consumer Marketing Research you can get to know the consumers
through data about them.
• The data analytics about consumers can be used in tools to create a marketing
strategy.
Linking tools to marketing strategy
• Linear regression → Market responses (e.g. pricing)
• Conjoint analysis→ New Product Design
• Bass Model→ New Product Diffusion
• Cluster Analysis→ Segmentation
• Multi-dimensional Scaling → Positioning
Principles of data-driven marketing
The principles are generic and applicable to almost all data-driven marketing situations.
• Principle 1: Any statistical analysis is to reduce information loss
• Principle 2: Causation cannot be learnt directly from data
• Principle 3: Prediction doesn’t care about statistical significance
• Principle 4: Practical usefulness triumphs statistical criteria
,Lecture 2- Market Response Model
Market Response Model: How to predict market response?
Description of a prediction machine
• Process: Data is gathered and put into the prediction machine with the objective of
finding a functional relationship between input and output. The output then is a
prediction.
• Objective: To find a functional relationship between input and output
• The prediction machine can take many forms and the functional relationship can take
many different forms. Often some deep learning is included.
Example of a prediction machine:
Linear regression to predict market response
A linear regression is one way to predict market response.
A linear regression represents y= a + bx
,Example toy: Starting from scratch- A simple linear regression
Scatter plot of price VS sales:
To start with, a scatter plot is created from all data points to start looking at the relationship
between price and sales.
Relationship:
The objective is to fit the relationship to a line:
Sales= a + bPrice
• a is the intercept
• b is the slope/coefficients
→ But how to draw the
line?
How to draw the line?
• What is a good prediction? → Principle: Any statistical analysis is to reduce
information loss (when going from observations to predictions).
, • Choose a line that minimizes the differences
5-step framework for a linear regression
A framework for conducting regression analysis in 5 steps:
Step 1: Examining the data
Detecting multicollinearity:
Sales= a + b1Price + b2Price
• Multicollinearity= When multiple independent variables contain the same
information or are highly correlated → Leads to biased and misleading estimated
coefficients.
How to detect multi-collinearity?
• Use the VIF function:
- VIF below 10: Not an issue
- VIF above 10: High collinearity
How to deal with multicollinearity?
• Use only one of the two variables in your regression
• Transform the correlated variables into a mutually independent set of predictors
(e.g. factor analysis). Downside: Difficult to interpret
• Collect more data
Step 2: Formulating the model
To decide which variables to use as input: