Fina Midterm
Conduct the appropriate hypothesis test and compute the p-value.
Sunshine Air has determined that their no-show rate for passengers booked on a flight is 6%. The Airline
has recently increased the cost of its travel insurance and suspects the no-show rate for passengers will
decrease.
A random sample of 380 reservations resulted in 18 no-shows.
At the 0.10 significance level, is there strong enough sample evidence to suggest that the no-show rate
in less than 6%?
Question options:
Yes, because the p-value = 0.15
No, because the p-value = 0.15
No, because the p-value = 0.10
Yes, because the p-value = 0.10
Determine the specified confidence interval.
An article estimates, with 90% confidence, that the proportion of elementary school teachers who are
female is 82%. The article also specifies a margin of error equal to 0.03.
Determine the resulting 90% confidence interval for the proportion of elementary school teachers who
are female.
Question options:
(0.79 , 0.82)
(0.87 , 0.93)
(0.82 , 0.85)
(0.805 , 0.835)
(0.79 , 0.85)
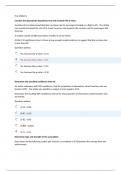
Determine type and strength of the association.
Data shown on the following scatter-plot indicate a correlation of 0.96 between the average flow rate
and pressure.
,Describe the association.
Question options:
No evidence of a correlation
Weak negative correlation
Strong positive correlation
Weak positive correlation
Strong negative correlation
Select the most appropriate response.
As sample size decreases (other things being equal), what tends to happen to 95% confidence intervals?
Question options:
They become narrower.
They will not change.
They become wider.
State your conclusion to the hypothesis test.
Is achieving a basic skill level in a subject independent to the location of the school? A random sample of
students categorized by the location of school and the number achieving basic skills in three subjects is
shown in the table.
, Subject
Location of School Reading Math Science
Urban 43 42 38
Suburban 63 66 65
Conduct a chi-square test of independence at the 1% significance level to test whether the two variables
are independent and state your conclusion.
Hint: the test statistic is: χ2=0.30
Question options:
There is not sufficient sample evidence to suggest that skill level in a subject is independent of location.
There is not sufficient sample evidence to suggest that skill level in a subject is dependent of location.
There is sufficient sample evidence to suggest that skill level in a subject is independent of location.
There is sufficient sample evidence to suggest that skill level in a subject is dependent of location.
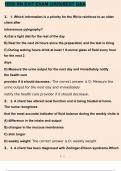
Determine the expect cell count for a Chi-Square Test of Independence
Determine the expected count under the null hypothesis.
Is achieving a basic skill level in a subject independent to the location of the school? A random sample of
students categorized by the location of school and the number achieving basic skills in three subjects is
shown in the table.
Subject
Location of School Reading Math Science Totals
Urban 43 42 38 123
Suburban 63 66 65 194
Totals 106 108 103 317
Under the null hypothesis for a Chi-square test of independence, what would be the expected number of
students achieving basic math skills in the urban schools?
Question options:
41.9
54.0
Conduct the appropriate hypothesis test and compute the p-value.
Sunshine Air has determined that their no-show rate for passengers booked on a flight is 6%. The Airline
has recently increased the cost of its travel insurance and suspects the no-show rate for passengers will
decrease.
A random sample of 380 reservations resulted in 18 no-shows.
At the 0.10 significance level, is there strong enough sample evidence to suggest that the no-show rate
in less than 6%?
Question options:
Yes, because the p-value = 0.15
No, because the p-value = 0.15
No, because the p-value = 0.10
Yes, because the p-value = 0.10
Determine the specified confidence interval.
An article estimates, with 90% confidence, that the proportion of elementary school teachers who are
female is 82%. The article also specifies a margin of error equal to 0.03.
Determine the resulting 90% confidence interval for the proportion of elementary school teachers who
are female.
Question options:
(0.79 , 0.82)
(0.87 , 0.93)
(0.82 , 0.85)
(0.805 , 0.835)
(0.79 , 0.85)
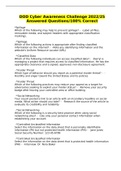
Determine type and strength of the association.
Data shown on the following scatter-plot indicate a correlation of 0.96 between the average flow rate
and pressure.
,Describe the association.
Question options:
No evidence of a correlation
Weak negative correlation
Strong positive correlation
Weak positive correlation
Strong negative correlation
Select the most appropriate response.
As sample size decreases (other things being equal), what tends to happen to 95% confidence intervals?
Question options:
They become narrower.
They will not change.
They become wider.
State your conclusion to the hypothesis test.
Is achieving a basic skill level in a subject independent to the location of the school? A random sample of
students categorized by the location of school and the number achieving basic skills in three subjects is
shown in the table.
, Subject
Location of School Reading Math Science
Urban 43 42 38
Suburban 63 66 65
Conduct a chi-square test of independence at the 1% significance level to test whether the two variables
are independent and state your conclusion.
Hint: the test statistic is: χ2=0.30
Question options:
There is not sufficient sample evidence to suggest that skill level in a subject is independent of location.
There is not sufficient sample evidence to suggest that skill level in a subject is dependent of location.
There is sufficient sample evidence to suggest that skill level in a subject is independent of location.
There is sufficient sample evidence to suggest that skill level in a subject is dependent of location.
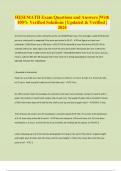
Determine the expect cell count for a Chi-Square Test of Independence
Determine the expected count under the null hypothesis.
Is achieving a basic skill level in a subject independent to the location of the school? A random sample of
students categorized by the location of school and the number achieving basic skills in three subjects is
shown in the table.
Subject
Location of School Reading Math Science Totals
Urban 43 42 38 123
Suburban 63 66 65 194
Totals 106 108 103 317
Under the null hypothesis for a Chi-square test of independence, what would be the expected number of
students achieving basic math skills in the urban schools?
Question options:
41.9
54.0