Advanced Business Analytics DSA 8590
Which type of chart would you use to visualize the relationship between two variables?
a) Histogram
b) Scatterplot
c)Box plot
d)Scatterplot Matrix - answerb)Correct! Scatterplot
Which of the following would NOT fall under business analytics?
a)analyzing data
b)collecting data
c)interpreting information
d)acting on information - answerd)Correct! acting on information
Employees' gender is stored in the form of F or M in the payroll data, but is stored in the
form of Female or Male in human resource data. These different ways to store the same
value lead to ____ in data?
a)Noise
b)Incompleteness
c)Error
d)Inconsistency - answerd)Correct! Inconsistency
Which type of chart would you use to visualize the comparison on a single variable
across several groups.?
a)Scatterplot Matrix
b)Correct Answer Box Plot
c) Histogram
d)Scatterplot - answerb)Correct Answer Box Plot
Which type of chart would you use to visualize the distribution of a single variable?
a)Scatterplot
b)Scatterplot Matrix
c)Box Plot
d)Histogram - answerc)Correct! Box Plot
Which of the following statement is correct?
-Lift is used to measure how likely two item sets co-occur by pure chance
-Conf(X->Y) may equal to Conf(Y->X)
-With 5 items, there will be 16 potential item sets
-Confidence is needed to calculate support - answerConf(X->Y) may equal to Conf(Y-
>X)
, Here is a dataset of 6 transactions.
Transaction No.Items Purchased
1: Juice, Bread, Butter, Ice Cream
2:Cereal, Juice, Milk
3:Bread, Cereal, Ice Cream, Milk
4: Bread, Butter, Cereal, Cheese, Juice
5: Bread, Ice Cream, Juice
6:Bread, Cheese, Juice, Milk
a) What is the support percentage of the association rule {Ice Cream} -> {Juice}?
(Rounding to one decimal place)
b) What is the confidence of the association rule {Ice Cream} -> {Juice}? (Rounding to
one decimal place)
c) What is the Lift of the association rule {Ice Cream} -> {Juice}? (Rounding to one
decimal place) - answera)0.3
b)0.7
c)0.8
Which of the following statements about clustering analysis is NOT correct?
-Clustering analysis organizes data points/objects into homogeneous and pre-defined
groups
-We want clustering results to have high intra-similarity
-We want clustering results to have low inter-similarity
-Clustering analysis is a type of exploratory data analytics as clusters come from data -
answerClustering analysis organizes data points/objects into homogeneous and pre-
defined groups
If your data is numeric, which of the following distance metrics is NOT applicable?
-Matching Distance
-Euclidean Distance
-Manhattan Distance
-Max-Coordinate Distance - answerMatching Distance
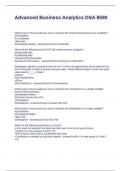
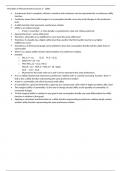
Suppose you apply hierarchical clustering on 7 data points {A, B, C, D, E, F, G} and
obtain the following dendrogram.
Based on the 3-cluster solution, which of the following statements about the
dendrogram is correct?
-E, F, and G belong to the same cluster
-A, B, C, and D belong to the same cluster
-C, D and E belong to the same cluster
-C, F and G belong to the same cluster - answerE, F, and G belong to the same cluster
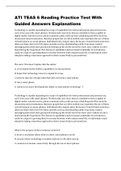
Consider the following dataset, which shows the results of 4 medical tests done for 3
different patients (1 - positive test result, 0 - negative test result). What is the Jaccard
Distance between A and C? (Rounding to one decimal place)
Which type of chart would you use to visualize the relationship between two variables?
a) Histogram
b) Scatterplot
c)Box plot
d)Scatterplot Matrix - answerb)Correct! Scatterplot
Which of the following would NOT fall under business analytics?
a)analyzing data
b)collecting data
c)interpreting information
d)acting on information - answerd)Correct! acting on information
Employees' gender is stored in the form of F or M in the payroll data, but is stored in the
form of Female or Male in human resource data. These different ways to store the same
value lead to ____ in data?
a)Noise
b)Incompleteness
c)Error
d)Inconsistency - answerd)Correct! Inconsistency
Which type of chart would you use to visualize the comparison on a single variable
across several groups.?
a)Scatterplot Matrix
b)Correct Answer Box Plot
c) Histogram
d)Scatterplot - answerb)Correct Answer Box Plot
Which type of chart would you use to visualize the distribution of a single variable?
a)Scatterplot
b)Scatterplot Matrix
c)Box Plot
d)Histogram - answerc)Correct! Box Plot
Which of the following statement is correct?
-Lift is used to measure how likely two item sets co-occur by pure chance
-Conf(X->Y) may equal to Conf(Y->X)
-With 5 items, there will be 16 potential item sets
-Confidence is needed to calculate support - answerConf(X->Y) may equal to Conf(Y-
>X)
, Here is a dataset of 6 transactions.
Transaction No.Items Purchased
1: Juice, Bread, Butter, Ice Cream
2:Cereal, Juice, Milk
3:Bread, Cereal, Ice Cream, Milk
4: Bread, Butter, Cereal, Cheese, Juice
5: Bread, Ice Cream, Juice
6:Bread, Cheese, Juice, Milk
a) What is the support percentage of the association rule {Ice Cream} -> {Juice}?
(Rounding to one decimal place)
b) What is the confidence of the association rule {Ice Cream} -> {Juice}? (Rounding to
one decimal place)
c) What is the Lift of the association rule {Ice Cream} -> {Juice}? (Rounding to one
decimal place) - answera)0.3
b)0.7
c)0.8
Which of the following statements about clustering analysis is NOT correct?
-Clustering analysis organizes data points/objects into homogeneous and pre-defined
groups
-We want clustering results to have high intra-similarity
-We want clustering results to have low inter-similarity
-Clustering analysis is a type of exploratory data analytics as clusters come from data -
answerClustering analysis organizes data points/objects into homogeneous and pre-
defined groups
If your data is numeric, which of the following distance metrics is NOT applicable?
-Matching Distance
-Euclidean Distance
-Manhattan Distance
-Max-Coordinate Distance - answerMatching Distance
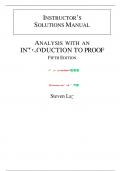
Suppose you apply hierarchical clustering on 7 data points {A, B, C, D, E, F, G} and
obtain the following dendrogram.
Based on the 3-cluster solution, which of the following statements about the
dendrogram is correct?
-E, F, and G belong to the same cluster
-A, B, C, and D belong to the same cluster
-C, D and E belong to the same cluster
-C, F and G belong to the same cluster - answerE, F, and G belong to the same cluster
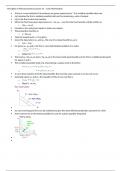
Consider the following dataset, which shows the results of 4 medical tests done for 3
different patients (1 - positive test result, 0 - negative test result). What is the Jaccard
Distance between A and C? (Rounding to one decimal place)