Assumpties checken in SPSS
Zieke handleiding over hoe je een legend wordt in SPSS
Basis Info
Vreemde waarden:
Via de procedure select cases kan je er voor zorgen dat de persoon met een lengte van bijna 20
meter niet mee wordt genomen in de analyses. Let er wel goed op dat als je bijvoorbeeld analyses
doet met de variabele gewicht, je deze persoon ook niet meer mee neemt (!). Je kan er dus ook voor
kiezen om onder het kopje variable view in de kolom ‘missings’ aan te geven dat de waarde 19,35 als
‘missing’ moet worden gezien.
Lineaire regressie: voorwaarden
1. kwantitatieve variabele als uitkomstmaat
2. uitkomstmaat normale verdeling → (Residuen zijn normaal verdeeld) of de steekproef is
dusdanig groot dat de centrale limietstelling kan worden toegepast. Dat laatste houdt in dat
het gemiddelde van de steekproef uit een – bij benadering - normale verdeling van
gemiddelden komt.
2 opties:
a) Checken of uitkomst normaal verdeeld is
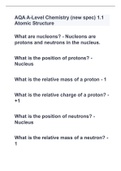
Spss→ analyze→ descriptive → frequencies → statistics: aanvinken zie afbeelding
→ charts: histogram + show normal curve
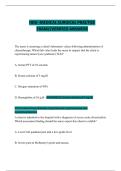
Te zien is dat de mediaan < gemiddelde → scheefrechts
De standaarddeviatie is behoorlijk groot t.o.v. het gemiddelde.
, iets te veel waarnemingen aan de rechterkant van de curve te vinden zijn om het bij een normale
verdeling te laten horen.
Maar: Centrale limietstelling!! N=250 dus steekproefgemiddelde een normale verdeling volgt
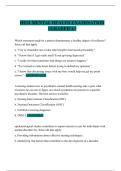
b) Checken of residuen normaal verdeeld zijn
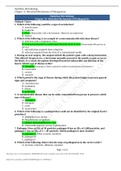
Spss→ analyze → regression → linear → (determinant & uitkomstvariabele invullen)
→ PLOTS : y=ZRESID x=ZPRED zie afbeelding
Residuen zijn normaal verdeeld
Zieke handleiding over hoe je een legend wordt in SPSS
Basis Info
Vreemde waarden:
Via de procedure select cases kan je er voor zorgen dat de persoon met een lengte van bijna 20
meter niet mee wordt genomen in de analyses. Let er wel goed op dat als je bijvoorbeeld analyses
doet met de variabele gewicht, je deze persoon ook niet meer mee neemt (!). Je kan er dus ook voor
kiezen om onder het kopje variable view in de kolom ‘missings’ aan te geven dat de waarde 19,35 als
‘missing’ moet worden gezien.
Lineaire regressie: voorwaarden
1. kwantitatieve variabele als uitkomstmaat
2. uitkomstmaat normale verdeling → (Residuen zijn normaal verdeeld) of de steekproef is
dusdanig groot dat de centrale limietstelling kan worden toegepast. Dat laatste houdt in dat
het gemiddelde van de steekproef uit een – bij benadering - normale verdeling van
gemiddelden komt.
2 opties:
a) Checken of uitkomst normaal verdeeld is
Spss→ analyze→ descriptive → frequencies → statistics: aanvinken zie afbeelding
→ charts: histogram + show normal curve
Te zien is dat de mediaan < gemiddelde → scheefrechts
De standaarddeviatie is behoorlijk groot t.o.v. het gemiddelde.
, iets te veel waarnemingen aan de rechterkant van de curve te vinden zijn om het bij een normale
verdeling te laten horen.
Maar: Centrale limietstelling!! N=250 dus steekproefgemiddelde een normale verdeling volgt
b) Checken of residuen normaal verdeeld zijn
Spss→ analyze → regression → linear → (determinant & uitkomstvariabele invullen)
→ PLOTS : y=ZRESID x=ZPRED zie afbeelding
Residuen zijn normaal verdeeld