Chapter 1 – Why is my evil lecturer forcing me to learn statistics?
(Lecture 1)
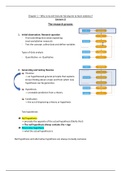
The research process
1. Initial observation: Research question
- Find something that needs explaining
(real world/other research)
- Test the concept: collect data and define variables
Types of data analysis
- Quantitative -vs- Qualitative
2. Generating and testing theories
Theories
-> an hypothesised general principle that explains
known finding about a topic and from which new
hypotheses can be generates.
Hypothesis
-> a testable prediction from a theory
Falsification
-> the act of disproving a theory or hypothesis
Two hypotheses
➔ Null hypothesis
-> precisely the opposite of the actual hypothesis (falsify this!)
-> The null hypothesis always contains the = sign
➔ Alternative hypothesis
-> what the actual hypothesis is
Null hypothesis and alternative hypothesis are always mutually exclusive
,3. Collective data: how to measure
➔ Variables
Independent variable
‘cause’, manipulated
Dependent variable:
‘effect’
Predictor variable:
thought to predict an outcome variable (independent)
Outcome variable:
dependent on the predictor variable
➔ Levels of measurement
Mean / Median / Mode
Mean / Mode
Mode
➔ Measurement error
‘the discrepancy between the actual value we’re trying to measure, and the number
we use to represent that value (=measured value)’
➔ Validity and reliability
Validity – does the instrument measure accurately?
Criterion validity – the degree to which a test actually measures behaviour
o Concurrent validity – correlation with other valid instrument
o Predictive validity – when data from the new instrument are used to predict
observations
Content validity – the degree to which the content of a test corresponds to the
content of the construct measured
Ecological validity – evidence that the results of a study, experiment of test can be
applied and allow inferences, to real-world conditions
Reliability - ability of the measure to produce the same results under the same
conditions (re-test, internal reliability, intercoder/observer reliability)
A measure is not valid if it is not reliable
, ➔ Correlational research
observe what naturally goes on in the world without directly interfering with it.
BUT: statements about causation cannot be made
➔ Experimental research
one or more variable is systematically manipulated to see their effect
AND: statements about the cause and effect can be made
➔ Methods of data collection
1. Between – subject
2. Within – subject
➔ Types of variation
Systematic variation (=effect) -> experimental manipulation
Unsystematic variation (= noise)
➔ Randomisation and Counterbalancing
= changing the order in which a person participates in a condition
1. Practice effects: participants preform differently in 2nd round due to practice
2. Boredom effects: participants perform differently in 2 nd round due to boredom
-> minimises unsystematic variation
4. Analysing data
1. Frequency distributions (aka histograms)
2. The normal distribution
(Lecture 1)
The research process
1. Initial observation: Research question
- Find something that needs explaining
(real world/other research)
- Test the concept: collect data and define variables
Types of data analysis
- Quantitative -vs- Qualitative
2. Generating and testing theories
Theories
-> an hypothesised general principle that explains
known finding about a topic and from which new
hypotheses can be generates.
Hypothesis
-> a testable prediction from a theory
Falsification
-> the act of disproving a theory or hypothesis
Two hypotheses
➔ Null hypothesis
-> precisely the opposite of the actual hypothesis (falsify this!)
-> The null hypothesis always contains the = sign
➔ Alternative hypothesis
-> what the actual hypothesis is
Null hypothesis and alternative hypothesis are always mutually exclusive
,3. Collective data: how to measure
➔ Variables
Independent variable
‘cause’, manipulated
Dependent variable:
‘effect’
Predictor variable:
thought to predict an outcome variable (independent)
Outcome variable:
dependent on the predictor variable
➔ Levels of measurement
Mean / Median / Mode
Mean / Mode
Mode
➔ Measurement error
‘the discrepancy between the actual value we’re trying to measure, and the number
we use to represent that value (=measured value)’
➔ Validity and reliability
Validity – does the instrument measure accurately?
Criterion validity – the degree to which a test actually measures behaviour
o Concurrent validity – correlation with other valid instrument
o Predictive validity – when data from the new instrument are used to predict
observations
Content validity – the degree to which the content of a test corresponds to the
content of the construct measured
Ecological validity – evidence that the results of a study, experiment of test can be
applied and allow inferences, to real-world conditions
Reliability - ability of the measure to produce the same results under the same
conditions (re-test, internal reliability, intercoder/observer reliability)
A measure is not valid if it is not reliable
, ➔ Correlational research
observe what naturally goes on in the world without directly interfering with it.
BUT: statements about causation cannot be made
➔ Experimental research
one or more variable is systematically manipulated to see their effect
AND: statements about the cause and effect can be made
➔ Methods of data collection
1. Between – subject
2. Within – subject
➔ Types of variation
Systematic variation (=effect) -> experimental manipulation
Unsystematic variation (= noise)
➔ Randomisation and Counterbalancing
= changing the order in which a person participates in a condition
1. Practice effects: participants preform differently in 2nd round due to practice
2. Boredom effects: participants perform differently in 2 nd round due to boredom
-> minimises unsystematic variation
4. Analysing data
1. Frequency distributions (aka histograms)
2. The normal distribution