Unit 2B - undertaking calorimetry to study cooling curves
The purpose of this experiment was to determine the temperature and visible changes whilst
studying the cooling curves of paraffin wax and stearic acid. To do this, I have to show and
explain ways in which calorimetry shows cooling curves. The technique, calorimetry, uses a
calorimeter to measure changes in chemical reaction and the stages of heat transfer and
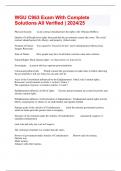
absorption. To use the calorimeter, place it into a boiling tube and place a thermometer
inside. This measures the temperature change overtime during the reaction.
Calibrating alcohol and digital thermometers
This experiment aims to test the accuracy of thermometers, in my experiment, I used a
digital and an alcohol thermometer. I did this to investigate the accuracy of the thermometers
and compare them to one another. I did this to validate my results in the later practicals and
ensure my accuracy. In this experiment, I predict that the most accurate thermometer will
◦ ◦
reach the closest to 0 𝐶 and 100 𝐶.
Apparatus: (For the freezing and boiling calibration)
Digital thermometer Heatproof mat Gauze
Alcohol thermometer Stirring rod Matches
3
2 x 50 𝑐𝑚 Beaker Stop clock
Ice cubes, distilled water Kettle
Bunsen burner Tripod
Method: Freezing point calibration
3
1) Fill the 50𝑐𝑚 beaker with ice and then fill it ⅔ of the way full with cold distilled water.
Stir the contents in the beaker and let it set for 3 minutes, use a stopwatch to
measure this.
2) Place the thermometers in the beaker, hold it away from the edges and at least 2
inches into the beaker.
3) Stir the ice water to evenly distribute the water's temperature, wait 30 seconds for the
thermometers to create stable readings, write these recordings down.
4) Every 30 seconds record the temperature of both thermometers using a stopwatch.
◦
5) Identify which thermometer recorded closest to 0 𝐶, record this and compare the
thermometers with one another.
Method: Boiling point method
3
1) Using the kettle, boil 50 𝑚𝑙 of distilled water, pour this into the the 50𝑐𝑚 beaker, fill
the beaker ⅔ of the way full.
2) Set up the bunsen burner, heat proof mat, tripod and gauze. Turn on the gas and
light a match. Turn the bunsen flame to safety until it is being used for the calibration.
, 3) Using oven gloves or tongs, pick up the beaker and place it onto the gauze. Turn the
bunsen burner flame to blue, place the thermometers into the beakers. Hold the
thermometers away from the edges and at least 2 inches into the beaker.
4) Stir the water so the temperature is even throughout, wait 30 seconds for the
thermometers to stabilise, then write these recordings down.
5) Every 30 seconds record the temperature of both thermometers using a stopwatch.
◦
6) Once the thermometers reach as close to 100 𝐶, record this and compare the
thermometers to one another.
7) Then conclude which thermometer recorded the most accurate results. (Which
◦ ◦
thermometer reached closest to 0 𝐶 and 100 𝐶.
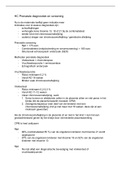
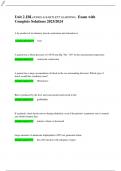
Type of thermometer: Temperature recorded in Temperature recorded in
◦ ◦
Ice: ( 𝐶) Boiling water: ( 𝐶)
Alcohol 5.2 94
Digital 1.8 99.9
Evaluating the thermometers accuracy
After carrying out this practical, I determined the digital thermometer was the most accurate
◦ ◦ ◦
at reading temperature closest to 0 𝐶 and 100 𝐶. The digital thermometer was 1. 8 𝐶 away
◦ ◦
from 0 𝐶, whereas the alcohol thermometer was 5. 2 𝐶 away for the freezing experiment.
The digital thermometer had the closer results for the freezing method, therefore, suggesting
◦ ◦
that it was more accurate. The digital thermometer was 0. 1 𝐶 away from 100 𝐶, whereas the
◦ ◦
alcohol thermometer was 6 𝐶 away from 100 𝐶. The digital thermometer had closer results
in the boiling method, therefore, suggesting it was more accurate. As a result, I used the
digital thermometer to carry out the next part of this practical, because it allowed me to
gather mostly accurate and precise recordings to discover the cooling curve of stearic acid
and paraffin wax and to draw my cooling curve graph.
The alcohol thermometer, whilst it was accurately calibrated, wasn't as accurate as the
digital thermometer. Whilst this may be the thermometer itself, my group and I may have
misinterpreted the results. To gather more accurate recordings, we should have had one
person measuring the temperature rather than more than one. Other people's judgement of
the measurements may have been different so this could have impacted the results we
gathered and decreased our level of precision. With liquid filled thermometers, the readings
are made by yourself, therefore we must consider we may have read this wrong, whereas
with digital thermometers, the readings are given to you as a visible number on the
The purpose of this experiment was to determine the temperature and visible changes whilst
studying the cooling curves of paraffin wax and stearic acid. To do this, I have to show and
explain ways in which calorimetry shows cooling curves. The technique, calorimetry, uses a
calorimeter to measure changes in chemical reaction and the stages of heat transfer and
absorption. To use the calorimeter, place it into a boiling tube and place a thermometer
inside. This measures the temperature change overtime during the reaction.
Calibrating alcohol and digital thermometers
This experiment aims to test the accuracy of thermometers, in my experiment, I used a
digital and an alcohol thermometer. I did this to investigate the accuracy of the thermometers
and compare them to one another. I did this to validate my results in the later practicals and
ensure my accuracy. In this experiment, I predict that the most accurate thermometer will
◦ ◦
reach the closest to 0 𝐶 and 100 𝐶.
Apparatus: (For the freezing and boiling calibration)
Digital thermometer Heatproof mat Gauze
Alcohol thermometer Stirring rod Matches
3
2 x 50 𝑐𝑚 Beaker Stop clock
Ice cubes, distilled water Kettle
Bunsen burner Tripod
Method: Freezing point calibration
3
1) Fill the 50𝑐𝑚 beaker with ice and then fill it ⅔ of the way full with cold distilled water.
Stir the contents in the beaker and let it set for 3 minutes, use a stopwatch to
measure this.
2) Place the thermometers in the beaker, hold it away from the edges and at least 2
inches into the beaker.
3) Stir the ice water to evenly distribute the water's temperature, wait 30 seconds for the
thermometers to create stable readings, write these recordings down.
4) Every 30 seconds record the temperature of both thermometers using a stopwatch.
◦
5) Identify which thermometer recorded closest to 0 𝐶, record this and compare the
thermometers with one another.
Method: Boiling point method
3
1) Using the kettle, boil 50 𝑚𝑙 of distilled water, pour this into the the 50𝑐𝑚 beaker, fill
the beaker ⅔ of the way full.
2) Set up the bunsen burner, heat proof mat, tripod and gauze. Turn on the gas and
light a match. Turn the bunsen flame to safety until it is being used for the calibration.
, 3) Using oven gloves or tongs, pick up the beaker and place it onto the gauze. Turn the
bunsen burner flame to blue, place the thermometers into the beakers. Hold the
thermometers away from the edges and at least 2 inches into the beaker.
4) Stir the water so the temperature is even throughout, wait 30 seconds for the
thermometers to stabilise, then write these recordings down.
5) Every 30 seconds record the temperature of both thermometers using a stopwatch.
◦
6) Once the thermometers reach as close to 100 𝐶, record this and compare the
thermometers to one another.
7) Then conclude which thermometer recorded the most accurate results. (Which
◦ ◦
thermometer reached closest to 0 𝐶 and 100 𝐶.
Type of thermometer: Temperature recorded in Temperature recorded in
◦ ◦
Ice: ( 𝐶) Boiling water: ( 𝐶)
Alcohol 5.2 94
Digital 1.8 99.9
Evaluating the thermometers accuracy
After carrying out this practical, I determined the digital thermometer was the most accurate
◦ ◦ ◦
at reading temperature closest to 0 𝐶 and 100 𝐶. The digital thermometer was 1. 8 𝐶 away
◦ ◦
from 0 𝐶, whereas the alcohol thermometer was 5. 2 𝐶 away for the freezing experiment.
The digital thermometer had the closer results for the freezing method, therefore, suggesting
◦ ◦
that it was more accurate. The digital thermometer was 0. 1 𝐶 away from 100 𝐶, whereas the
◦ ◦
alcohol thermometer was 6 𝐶 away from 100 𝐶. The digital thermometer had closer results
in the boiling method, therefore, suggesting it was more accurate. As a result, I used the
digital thermometer to carry out the next part of this practical, because it allowed me to
gather mostly accurate and precise recordings to discover the cooling curve of stearic acid
and paraffin wax and to draw my cooling curve graph.
The alcohol thermometer, whilst it was accurately calibrated, wasn't as accurate as the
digital thermometer. Whilst this may be the thermometer itself, my group and I may have
misinterpreted the results. To gather more accurate recordings, we should have had one
person measuring the temperature rather than more than one. Other people's judgement of
the measurements may have been different so this could have impacted the results we
gathered and decreased our level of precision. With liquid filled thermometers, the readings
are made by yourself, therefore we must consider we may have read this wrong, whereas
with digital thermometers, the readings are given to you as a visible number on the