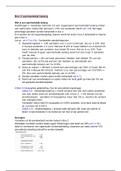
Correlation:
T-tests Hypothesis Df Where to use
t=
.√&'( H0: r=0 Df= n – 2 To test if there is a correlation
0'. ! between x and y. 1 predictor
!
variable.
t = 12 H0: b=0
03. H0: r=0
rz= 0.5 × ln(0'.)
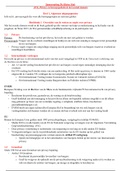
Linear regression:
T-tests and CI Hypothesis Df Where to use
!" H0: bi=0 Df= n – p – 1 To test if one of the predictors
t = #$!"
has an effect on y.
Df= n – p – 1
CI: 𝑏" ± 𝑡 ∗ × 𝑆𝐸!"
The confidence for the model
∗
𝑏 ± 𝑡&'( × 𝑆𝐸! Df= n – 2 parameter 𝛽.
The confidence interval for the
∗
𝐸(𝑦) ± 𝑡&'( × 𝑆𝐸)*+, Df= n – 2 mean response.
The prediction interval for a
∗
𝑦ℎ𝑎𝑡 ± 𝑡&'( × 𝑆𝐸-*+, Df= n – 2 value of y, for one individual.
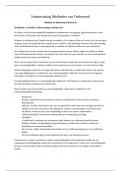
2-ANOVA CI:
CI Df Where to use
𝑠𝑝 Df= n – g (one-way) The confidence interval of the population
𝑦𝑏𝑎𝑟𝑖 ± 𝑡 ∗
√𝑛𝑖 Df= n – (I x J) (two- mean.
way)
𝑠𝑖 Df= ni- 1 The confidence interval for an individual in
𝑦𝑏𝑎𝑟𝑖 ± 𝑡 ∗ group i.
√𝑛𝑖
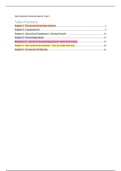
1-ANOVA table regression:
SS Df MS F
Model Sum(yhati – ybar)2 p (= g – 1) SSM/Dfm MSM/MSE
Error Sum(yi – yhati)2 n–p–1 SSE/Dfe = s2
Total Sum(yi – ybar)2 n–1 TSS/Dft= sy2
1-ANOVA table groups:
SS Df MS F
Group Sum(ybari – ybar)2 g–1 SSGr/DfGr MSGr/MSE
Error Sum(yij – ybari)2 n–g SSE/DfE
Total Sum(yij – ybar)2 n-1 TSS/DfT
2-ANOVA table:
SS Df MS F
Factor A SSA i–1 SSA/DfA MSA/MSE
Factor B SSB j–1 SSB/DfB MSB/MSE
Interaction SSAB (i – 1 )(j – 1) SSAB/DfAB MSAB/MSE
T-tests Hypothesis Df Where to use
t=
.√&'( H0: r=0 Df= n – 2 To test if there is a correlation
0'. ! between x and y. 1 predictor
!
variable.
t = 12 H0: b=0
03. H0: r=0
rz= 0.5 × ln(0'.)
Linear regression:
T-tests and CI Hypothesis Df Where to use
!" H0: bi=0 Df= n – p – 1 To test if one of the predictors
t = #$!"
has an effect on y.
Df= n – p – 1
CI: 𝑏" ± 𝑡 ∗ × 𝑆𝐸!"
The confidence for the model
∗
𝑏 ± 𝑡&'( × 𝑆𝐸! Df= n – 2 parameter 𝛽.
The confidence interval for the
∗
𝐸(𝑦) ± 𝑡&'( × 𝑆𝐸)*+, Df= n – 2 mean response.
The prediction interval for a
∗
𝑦ℎ𝑎𝑡 ± 𝑡&'( × 𝑆𝐸-*+, Df= n – 2 value of y, for one individual.
2-ANOVA CI:
CI Df Where to use
𝑠𝑝 Df= n – g (one-way) The confidence interval of the population
𝑦𝑏𝑎𝑟𝑖 ± 𝑡 ∗
√𝑛𝑖 Df= n – (I x J) (two- mean.
way)
𝑠𝑖 Df= ni- 1 The confidence interval for an individual in
𝑦𝑏𝑎𝑟𝑖 ± 𝑡 ∗ group i.
√𝑛𝑖
1-ANOVA table regression:
SS Df MS F
Model Sum(yhati – ybar)2 p (= g – 1) SSM/Dfm MSM/MSE
Error Sum(yi – yhati)2 n–p–1 SSE/Dfe = s2
Total Sum(yi – ybar)2 n–1 TSS/Dft= sy2
1-ANOVA table groups:
SS Df MS F
Group Sum(ybari – ybar)2 g–1 SSGr/DfGr MSGr/MSE
Error Sum(yij – ybari)2 n–g SSE/DfE
Total Sum(yij – ybar)2 n-1 TSS/DfT
2-ANOVA table:
SS Df MS F
Factor A SSA i–1 SSA/DfA MSA/MSE
Factor B SSB j–1 SSB/DfB MSB/MSE
Interaction SSAB (i – 1 )(j – 1) SSAB/DfAB MSAB/MSE