* Some questions not yet gradedFinal Exam - Requires Respondus LockDown Browser +
Webcam
Attempt History
Attempt Time Score
LATEST Attempt 1 83 minutes 0 out of 100 *
Score for this quiz: 0 out of 100 *
Submitted Nov 6 at 11:32pm This attempt took 83 minutes.
Not yet graded / 10 pts Question 1
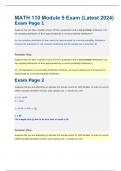
Your Answer:You may find the following files helpful throughout the exam: Statistics_Equation_Sheet The following pie chart shows the percentages of total items sold in a month in a
certain fast food restaurant.
A total of 2900 fast food items were sold during the month. a.) How many were burgers? b.) How many were fish? notes 2,900 fast food
burger 12%
fish 28 % burger 2,900(.12)=348
Fish 2,900 (.28)=812
a.) Burgers : 2900(.12) = 348
b.) Fish : 2900(.28) = 812
Not yet graded / 10 pts Question 2
You may find the following files helpful throughout the exam: Statistics_Equation_Sheet Consider the following data:
437 389 414 401 466 421 399 387 450 407 392 410
440 417 488
Find the 60th percentile of this data.
Webcam
Attempt History
Attempt Time Score
LATEST Attempt 1 83 minutes 0 out of 100 *
Score for this quiz: 0 out of 100 *
Submitted Nov 6 at 11:32pm This attempt took 83 minutes.
Not yet graded / 10 pts Question 1
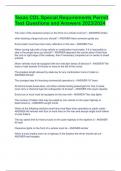
Your Answer:You may find the following files helpful throughout the exam: Statistics_Equation_Sheet The following pie chart shows the percentages of total items sold in a month in a
certain fast food restaurant.
A total of 2900 fast food items were sold during the month. a.) How many were burgers? b.) How many were fish? notes 2,900 fast food
burger 12%
fish 28 % burger 2,900(.12)=348
Fish 2,900 (.28)=812
a.) Burgers : 2900(.12) = 348
b.) Fish : 2900(.28) = 812
Not yet graded / 10 pts Question 2
You may find the following files helpful throughout the exam: Statistics_Equation_Sheet Consider the following data:
437 389 414 401 466 421 399 387 450 407 392 410
440 417 488
Find the 60th percentile of this data.