/
UNIVERSITY OF CAPE TOWN
DEPARTMENT OF STATISTICAL SCIENCES
STA3022F
JUNE 2019 EXAMINATION
INTERNAL EXAMINERS: Dr S Er, Mr M Z Ngwenya TOTAL MARKS: 100
INTERNAL ASSESSOR: A/Prof F Little
EXTERNAL EXAMINER: Dr Mome Lamont TIME ALLOWED: 3 hours
PAGES: 20 pages
INSTRUCTIONS: 9 QUESTIONS IN TOTAL.
ANSWER EACH SECTION IN A SEPARA TE BOOK.
MARKS ARE ALLOCATED FOR INTERMEDIATE CALCULATIONS.
SECTION A: EXPLORATORY METHODS [Available marks: 45]
ANSWER EACH SECTION IN A SEPARA TE BOOK
Question 1 [11 marks)
Data were available to examine the relationship between the level of prostate-specific antigen and
several clinical measures in men who were about to receive a radical prostatectomy. The clinical
measures were log cancer volume (lcavol), log weight (/weight), age, log of the amount of benign
prostatic hyperplasia (lbph), log of capsular penetration (lcp), gleason and lpsa response. The data
were standardized, and a principal component analysis was performed the results of which are given
below.
> prostate.pca$loadings
Loadings:
comp.l comp.2 comp.3 comp.4 comp.5 comp.6 comp.?
vfcavol 0.489 0.231 0.167 0.197 0.315 0.148 0.720
lweight 0.311 -0.482 0.399 0.158 -0.648 -0.219 0.136
age 0.264 -0.418 -0.562 0.608 0.204 -0.170
..J'bph 0.181 -0.617 -0.645 0.398
v'lcp 0.441 0.332 -0.104 0.128 -0.771 -0.270
vgleason 0.366 0.209 -0.598 -0.373 -0.504 0.252
vlpsa 0.483 0.371 0.103 0.520 -0.586
\(a)Write down expressions for the first three principal components. (3)
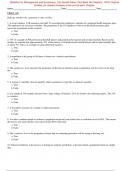
sing the scree plot below determine
i) The percentage of variation explained by the first three components individually. (3)
1 a
, Ji The percentage of variation explained by the first three components combined. (1)
3.0 0 2.935
2.5
is i
2.0
u,
(I)
(.)
C
co
1.5
0\
1.0
o 0.882
0~
0.5
O~O~
0
0.207
.... N (') sq: CC! r-
a. ci. ci. a. a. a. ci.
E E E E E : E E
0 0 0 0 0 0 0
u u u u u u u
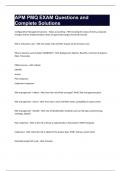
(c) Using the PCA biplot below to answer the following questions.
i) Which subject has the highest lbph value? What is this value?~~ -t-i.Ji.1-- (2)
JiY'Which two variables are most correlated? Is this correlation positive or negative? (2)
ageand height
2
UNIVERSITY OF CAPE TOWN
DEPARTMENT OF STATISTICAL SCIENCES
STA3022F
JUNE 2019 EXAMINATION
INTERNAL EXAMINERS: Dr S Er, Mr M Z Ngwenya TOTAL MARKS: 100
INTERNAL ASSESSOR: A/Prof F Little
EXTERNAL EXAMINER: Dr Mome Lamont TIME ALLOWED: 3 hours
PAGES: 20 pages
INSTRUCTIONS: 9 QUESTIONS IN TOTAL.
ANSWER EACH SECTION IN A SEPARA TE BOOK.
MARKS ARE ALLOCATED FOR INTERMEDIATE CALCULATIONS.
SECTION A: EXPLORATORY METHODS [Available marks: 45]
ANSWER EACH SECTION IN A SEPARA TE BOOK
Question 1 [11 marks)
Data were available to examine the relationship between the level of prostate-specific antigen and
several clinical measures in men who were about to receive a radical prostatectomy. The clinical
measures were log cancer volume (lcavol), log weight (/weight), age, log of the amount of benign
prostatic hyperplasia (lbph), log of capsular penetration (lcp), gleason and lpsa response. The data
were standardized, and a principal component analysis was performed the results of which are given
below.
> prostate.pca$loadings
Loadings:
comp.l comp.2 comp.3 comp.4 comp.5 comp.6 comp.?
vfcavol 0.489 0.231 0.167 0.197 0.315 0.148 0.720
lweight 0.311 -0.482 0.399 0.158 -0.648 -0.219 0.136
age 0.264 -0.418 -0.562 0.608 0.204 -0.170
..J'bph 0.181 -0.617 -0.645 0.398
v'lcp 0.441 0.332 -0.104 0.128 -0.771 -0.270
vgleason 0.366 0.209 -0.598 -0.373 -0.504 0.252
vlpsa 0.483 0.371 0.103 0.520 -0.586
\(a)Write down expressions for the first three principal components. (3)
sing the scree plot below determine
i) The percentage of variation explained by the first three components individually. (3)
1 a
, Ji The percentage of variation explained by the first three components combined. (1)
3.0 0 2.935
2.5
is i
2.0
u,
(I)
(.)
C
co
1.5
0\
1.0
o 0.882
0~
0.5
O~O~
0
0.207
.... N (') sq: CC! r-
a. ci. ci. a. a. a. ci.
E E E E E : E E
0 0 0 0 0 0 0
u u u u u u u
(c) Using the PCA biplot below to answer the following questions.
i) Which subject has the highest lbph value? What is this value?~~ -t-i.Ji.1-- (2)
JiY'Which two variables are most correlated? Is this correlation positive or negative? (2)
ageand height
2