⑳
·
⑱
⑭
& ·
I
9) PCA
b) ANOUA
c) Correspondence Analysis
9) Multidimensional scaling
e) Cluster
analysis (discrete feature would be classification trees
9) Structural Equ Modelling
mar 9
,8 variables and 250 observations.
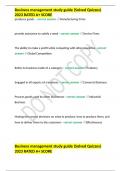
> PCAheartSloadings
Loadings:
comp.1 comp.2 comp.3 comp.4 comp.5 comp.6 comp.7 comp.8
sbp 0.313 0.184 0.623 0.661 0.139 0.126
tobacco 0.290 0.484 -0.533 0.207 -0.329 0.480 -0.101
l dl 0.346 -0.300 -0.103 -0.349 0.769 0.244
adiposity 0.536 -0.175 0.112 -0.198 -0.120 -0.183 -0.763
typea 0.239 -0.960 -0.132
obesity 0.417 -0.327 -0.146 0.257 -0.364 -0.361 0.394 0.461
alcohol 0.647 0.122 0.275 -0.585 0.365
age 0.479 0.165 0.143 -0.226 -0.693 0.433
;rf Construct a scree plot using just the first six dimensiop.s. (2)
Jif Write out the equations for the first two principal components. (2)
if Detem1ine the percentage of explained variation for each of the first three principal
components individually as well as the combined variation explained by the first three
principal components. (4)
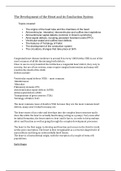
-dj Use the two PCA biplots below to answer the following questions:
fr Identify the two sets of highly correlated variables? v (2)
,i-i1' Which variable is negatively correlated with obesity? .,,, (1)
Which participant in the study had high values for ldl and adiposity? (1)
0
s:::.
0 0)
ro
u a.
.;
Sb
·2
ad1pos1
.;;
0)
D
0
Figure 1
2
, a) The scree glot shows the variances of the
components
:
11662- ·
To done 1st
Y
save time I've
just 3
Var
11143
components. The variances come from
-
·
0
, 992 &
there
squaring
-
.
=
or
-
123 ---
component =>
b) Y , = 0 , 313sbp + 0 . 290 tobacco + 0 , 346 Ide + 0 , 53J adiposity
to , 417 obesity + 0 , 479
age Y1 Yz
&z = 0
, 184sby + 0
, 404 tobacco--- >
-
1
,
662
2) Comp 1 :
1 1 662 + 11147 + 0
,
997 + 0912+ ... + 04/2
1, 142
!
2 997
1) 662 + 11142 + 0
,
+ 19127 ... + 04/2
0
,
992
3: 997
1) 662 + 11142 + 0
,
+ 19127 ... + 04/2
1 ,
66" + 1142 +0
,
99h
All 3: 997 + 19127 04/2
1) 662 + 11142 + 0
,
... +
di) Alcohol and type A ; Ide and cholesterol
obesity
ii) There does not
unrelated
appear to
be
any
such variable
, although tobacco
appears
iii) 82
·
⑱
⑭
& ·
I
9) PCA
b) ANOUA
c) Correspondence Analysis
9) Multidimensional scaling
e) Cluster
analysis (discrete feature would be classification trees
9) Structural Equ Modelling
mar 9
,8 variables and 250 observations.
> PCAheartSloadings
Loadings:
comp.1 comp.2 comp.3 comp.4 comp.5 comp.6 comp.7 comp.8
sbp 0.313 0.184 0.623 0.661 0.139 0.126
tobacco 0.290 0.484 -0.533 0.207 -0.329 0.480 -0.101
l dl 0.346 -0.300 -0.103 -0.349 0.769 0.244
adiposity 0.536 -0.175 0.112 -0.198 -0.120 -0.183 -0.763
typea 0.239 -0.960 -0.132
obesity 0.417 -0.327 -0.146 0.257 -0.364 -0.361 0.394 0.461
alcohol 0.647 0.122 0.275 -0.585 0.365
age 0.479 0.165 0.143 -0.226 -0.693 0.433
;rf Construct a scree plot using just the first six dimensiop.s. (2)
Jif Write out the equations for the first two principal components. (2)
if Detem1ine the percentage of explained variation for each of the first three principal
components individually as well as the combined variation explained by the first three
principal components. (4)
-dj Use the two PCA biplots below to answer the following questions:
fr Identify the two sets of highly correlated variables? v (2)
,i-i1' Which variable is negatively correlated with obesity? .,,, (1)
Which participant in the study had high values for ldl and adiposity? (1)
0
s:::.
0 0)
ro
u a.
.;
Sb
·2
ad1pos1
.;;
0)
D
0
Figure 1
2
, a) The scree glot shows the variances of the
components
:
11662- ·
To done 1st
Y
save time I've
just 3
Var
11143
components. The variances come from
-
·
0
, 992 &
there
squaring
-
.
=
or
-
123 ---
component =>
b) Y , = 0 , 313sbp + 0 . 290 tobacco + 0 , 346 Ide + 0 , 53J adiposity
to , 417 obesity + 0 , 479
age Y1 Yz
&z = 0
, 184sby + 0
, 404 tobacco--- >
-
1
,
662
2) Comp 1 :
1 1 662 + 11147 + 0
,
997 + 0912+ ... + 04/2
1, 142
!
2 997
1) 662 + 11142 + 0
,
+ 19127 ... + 04/2
0
,
992
3: 997
1) 662 + 11142 + 0
,
+ 19127 ... + 04/2
1 ,
66" + 1142 +0
,
99h
All 3: 997 + 19127 04/2
1) 662 + 11142 + 0
,
... +
di) Alcohol and type A ; Ide and cholesterol
obesity
ii) There does not
unrelated
appear to
be
any
such variable
, although tobacco
appears
iii) 82