Chapter 1:
Estimation of Causal effects
Randomized controlled trials: a method of estimating causal effects:
- Control group: does not receive treatment
- Treatment group: receives treatment
- Difference between the groups: causal effect of treatment
- Do not need to know a causal effect to make a forecast
Data: Sources and Types
Experimental data: data from controlled experiments investigating causal effects
Observational data: data from outside the experiment setting (surveys, historical records
etc)
- Difficult to find causal effects (as no treatment or control groups)
Cross-sectional data: data on different entities / on many different subjects
- E.g. GDP of many different countries
- observation number: arbitrarily assigned number to one subject that organizes the
data
Time series data: data from single entity / subject collected at multiple time periods
- E.g. growth rate of GDP in US over time
- Can be used to study trends and forecast
Panel / longitudinal data: multiple entities / subjects in which each entity is observed at two
or more time periods.
- Combination of cross-sectional and time series data
Chapter 3.5: Estimation of Causal
Effects using Experimental data
Causal effect of a treatment / treatment effect: expected effect on the outcome of interest
of the treatment as measured in an ideal randomized controlled experiment
- Difference of two conditional expectations
- E(Y | X = x) - E(Y | X = 0)
- EV of Treatment group x - EV of control group
Causal effect of binary controlled experiment: difference in mean outcomes
- Causal effect = mean outcome treatment group - control group
,Ecological Fallacy: erroneously drawing conclusions about individuals solely from the
observations of higher aggregations
- Cannot draw conclusions at individual level from aggregate analysis
Conceptualization: The process through which we specify what we mean when we use a
particular term in research.
- Defining the meaning of words used in the study
- Typically difficult In social sciences
- Defining abstract ideas with specific characteristics..
Operationalization: specifying how a variable or concept will be measured in a specific
study.
Operationalization: criteria for measurement quality
1. Reliability:
a. Quality of measurement method
b. Repeated observations of same phenomenon result in the same data
2. Validity:
a. A valid measure accurately reflects the concept it is intended to measure
b. You actually measure what you want to measure
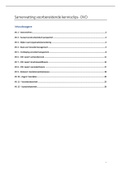
Chapter 4: Linear Regression
Linear regression model: Yi = β0 + β1Xi+ ui
- Yi is
the dependent variable / regressand / left-hand variable;
- Xi is the independent variable / regressor / right-hand variable;
- β0 + β1Xi is the population regression function;
- Average relationship between X and Y
- β0 is the intercept
- Only interpretable if value of 0 for X is reasonable
- β1 is the slope
- How much Yi changes if Xi changes by 1
- ui is the error term
- Vertical distance from observation to regression line
- Contains all the other factors besides X that determine the value of the
dependent variable
n
1
Sample covariance: n−1 ∑ (X i − X avr )(Y i − Y avr )
i=1
- Why n-1? → corrects for a slight downward bias introduced because two regression
coefficients were estimated
- Tells us if X and Y tend to move in the same (+) or opposite directions (-)
- Units: units of X × units of Y
- n = sample size
- Xi or Yi = value of X or Y for observation i
- Xavr or Yavr = sample average of X or Y
, s XY
Sample correlation (coefficient): r XY = sX sY
- sXY = covariance, sx = st. dev of X, sY is st. dev of Y
- Always between -1 and 1
- Strength of linear relationship between X and Y
How does OLS work:
n
- OLS finds β0 and β1 so that ∑ (Y i − β 0 − β 1 X i ) 2 is minimized
i=1
- Vertical distance between observation Yi and line is: Y i − β 0 − β 1 X 1
- Squared distances must be minimized to fit the line best
- Why squared distance?
- Accounts for both positive and negative distances
- Puts more weight on points closer to the line
n
∑ (X i −X avr )(Y i −Y avr )
i=1 s XY Cov(XY )
OLS Estimator of β1: β1= n = 2 =
∑ (X i −X) 2 sX s 2x
i=i
OLS Estimator of β0 : β 0 = Y − β 1 X
Predicted values: Ypredi = β0 + β1Xi
Residuals: ûi = Yi - Yipred
Measures of fit
R Squared (R2): how well the regression fits the data (1 is perfect, 0 is not at all)
- Measures the fraction of the variance of Yi that is explained by Xi
- R2 = corr(Yi,Xi)2
- R2 = corr(Ypredi,Yactuali)2
ESS SSR
R2 = T SS =1- T SS
n
- Total variation (Total Sum of Squares): T SS = ∑ (Y i − Y ) 2
i=1
- Note: actual observation Yi
n ︿
- Explained variation: E SS = ∑ (Y i − Y ) 2
i=1
- Note: predicted Y
n
︿
- Sum of Squared Residuals: S SR = ∑ ui 2
i=1
Standard Error of Regression (SER):
, - estimator of the standard deviation of the regression error ui
- Measure of spread of the observations around the regression line
- If SER is large → predictions often very different from actual values
2
√
2 SSR
S ER = s︿u = s ︿
u
where s = ︿
u n−2
- Divide by n-2 because there are two degrees of freedom (two coefficients were
estimated, namely β0 and β1)
Assumptions of Ordinary Least-Square Regression:
1. None of the regressors is correlated with the error term
a. ‘Zero conditional mean assumption’ → E(ui | Xi) = 0
b. EV of ui is always 0, regardless of Xi → corr(ui , Xi) = 0
c. If Xi is taken at random → conditions holds
2. Observations are independent and identically distributed (i.i.d.)
a. If (Xi, Yi) have the same distribution (e.g. drawn from same population)
b. Are independent
c. Does NOT hold for:
i. Time series
ii. Panel data (multiple observations for the same entity)
iii. Non-representative samples
3. Large outliers are unlikely
a. OLS is sensitive to large outliers
b. 0 < E(Xi4) < ∞ and 0 < E(Yi4) < ∞
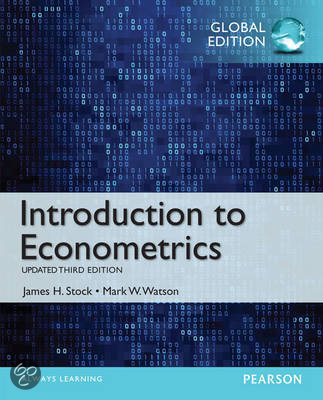
Sampling Distributions of OLS Estimators
β0 and β1 are random variables with probability
distribution
- As they are computed from a random sample
- Different sample → different estimates
- With many large samples: est. β1 follows normal
distribution, centered at actual β1
Why is β1 normally distributed?
- Central limit theorem: variables in large enough samples with a finite level of variance
follow approximate normal distribution pattern
- All requirements of CLT for β1 are fulfilled → β1 follows approx. normal distribution
Mean of OLS Estimator and unbiasedness
Means of estimated β0 and β1
- E(β0est) = β0 (EV of estimated β0 equals true β0)
est
- E(β1 ) = β1 (EV of estimated β1 equals true β0)
- → OLS Estimators are unbiased
Unbiasedness of β1: (see slides lecture 3 wk 1)
Estimation of Causal effects
Randomized controlled trials: a method of estimating causal effects:
- Control group: does not receive treatment
- Treatment group: receives treatment
- Difference between the groups: causal effect of treatment
- Do not need to know a causal effect to make a forecast
Data: Sources and Types
Experimental data: data from controlled experiments investigating causal effects
Observational data: data from outside the experiment setting (surveys, historical records
etc)
- Difficult to find causal effects (as no treatment or control groups)
Cross-sectional data: data on different entities / on many different subjects
- E.g. GDP of many different countries
- observation number: arbitrarily assigned number to one subject that organizes the
data
Time series data: data from single entity / subject collected at multiple time periods
- E.g. growth rate of GDP in US over time
- Can be used to study trends and forecast
Panel / longitudinal data: multiple entities / subjects in which each entity is observed at two
or more time periods.
- Combination of cross-sectional and time series data
Chapter 3.5: Estimation of Causal
Effects using Experimental data
Causal effect of a treatment / treatment effect: expected effect on the outcome of interest
of the treatment as measured in an ideal randomized controlled experiment
- Difference of two conditional expectations
- E(Y | X = x) - E(Y | X = 0)
- EV of Treatment group x - EV of control group
Causal effect of binary controlled experiment: difference in mean outcomes
- Causal effect = mean outcome treatment group - control group
,Ecological Fallacy: erroneously drawing conclusions about individuals solely from the
observations of higher aggregations
- Cannot draw conclusions at individual level from aggregate analysis
Conceptualization: The process through which we specify what we mean when we use a
particular term in research.
- Defining the meaning of words used in the study
- Typically difficult In social sciences
- Defining abstract ideas with specific characteristics..
Operationalization: specifying how a variable or concept will be measured in a specific
study.
Operationalization: criteria for measurement quality
1. Reliability:
a. Quality of measurement method
b. Repeated observations of same phenomenon result in the same data
2. Validity:
a. A valid measure accurately reflects the concept it is intended to measure
b. You actually measure what you want to measure
Chapter 4: Linear Regression
Linear regression model: Yi = β0 + β1Xi+ ui
- Yi is
the dependent variable / regressand / left-hand variable;
- Xi is the independent variable / regressor / right-hand variable;
- β0 + β1Xi is the population regression function;
- Average relationship between X and Y
- β0 is the intercept
- Only interpretable if value of 0 for X is reasonable
- β1 is the slope
- How much Yi changes if Xi changes by 1
- ui is the error term
- Vertical distance from observation to regression line
- Contains all the other factors besides X that determine the value of the
dependent variable
n
1
Sample covariance: n−1 ∑ (X i − X avr )(Y i − Y avr )
i=1
- Why n-1? → corrects for a slight downward bias introduced because two regression
coefficients were estimated
- Tells us if X and Y tend to move in the same (+) or opposite directions (-)
- Units: units of X × units of Y
- n = sample size
- Xi or Yi = value of X or Y for observation i
- Xavr or Yavr = sample average of X or Y
, s XY
Sample correlation (coefficient): r XY = sX sY
- sXY = covariance, sx = st. dev of X, sY is st. dev of Y
- Always between -1 and 1
- Strength of linear relationship between X and Y
How does OLS work:
n
- OLS finds β0 and β1 so that ∑ (Y i − β 0 − β 1 X i ) 2 is minimized
i=1
- Vertical distance between observation Yi and line is: Y i − β 0 − β 1 X 1
- Squared distances must be minimized to fit the line best
- Why squared distance?
- Accounts for both positive and negative distances
- Puts more weight on points closer to the line
n
∑ (X i −X avr )(Y i −Y avr )
i=1 s XY Cov(XY )
OLS Estimator of β1: β1= n = 2 =
∑ (X i −X) 2 sX s 2x
i=i
OLS Estimator of β0 : β 0 = Y − β 1 X
Predicted values: Ypredi = β0 + β1Xi
Residuals: ûi = Yi - Yipred
Measures of fit
R Squared (R2): how well the regression fits the data (1 is perfect, 0 is not at all)
- Measures the fraction of the variance of Yi that is explained by Xi
- R2 = corr(Yi,Xi)2
- R2 = corr(Ypredi,Yactuali)2
ESS SSR
R2 = T SS =1- T SS
n
- Total variation (Total Sum of Squares): T SS = ∑ (Y i − Y ) 2
i=1
- Note: actual observation Yi
n ︿
- Explained variation: E SS = ∑ (Y i − Y ) 2
i=1
- Note: predicted Y
n
︿
- Sum of Squared Residuals: S SR = ∑ ui 2
i=1
Standard Error of Regression (SER):
, - estimator of the standard deviation of the regression error ui
- Measure of spread of the observations around the regression line
- If SER is large → predictions often very different from actual values
2
√
2 SSR
S ER = s︿u = s ︿
u
where s = ︿
u n−2
- Divide by n-2 because there are two degrees of freedom (two coefficients were
estimated, namely β0 and β1)
Assumptions of Ordinary Least-Square Regression:
1. None of the regressors is correlated with the error term
a. ‘Zero conditional mean assumption’ → E(ui | Xi) = 0
b. EV of ui is always 0, regardless of Xi → corr(ui , Xi) = 0
c. If Xi is taken at random → conditions holds
2. Observations are independent and identically distributed (i.i.d.)
a. If (Xi, Yi) have the same distribution (e.g. drawn from same population)
b. Are independent
c. Does NOT hold for:
i. Time series
ii. Panel data (multiple observations for the same entity)
iii. Non-representative samples
3. Large outliers are unlikely
a. OLS is sensitive to large outliers
b. 0 < E(Xi4) < ∞ and 0 < E(Yi4) < ∞
Sampling Distributions of OLS Estimators
β0 and β1 are random variables with probability
distribution
- As they are computed from a random sample
- Different sample → different estimates
- With many large samples: est. β1 follows normal
distribution, centered at actual β1
Why is β1 normally distributed?
- Central limit theorem: variables in large enough samples with a finite level of variance
follow approximate normal distribution pattern
- All requirements of CLT for β1 are fulfilled → β1 follows approx. normal distribution
Mean of OLS Estimator and unbiasedness
Means of estimated β0 and β1
- E(β0est) = β0 (EV of estimated β0 equals true β0)
est
- E(β1 ) = β1 (EV of estimated β1 equals true β0)
- → OLS Estimators are unbiased
Unbiasedness of β1: (see slides lecture 3 wk 1)