AMDA Spring Summary
1
,Moderation and Mediation- Lecture 1: Moderation
• In moderation and mediation there is an independent variable (X) that predicts a dependent
variable (Y) and a third variable (Z), which qualifies (moderation) or explains (mediation) the
relationship between X and Y.
• The X-Y relationship is different (stronger/weaker, or different sign(+/-)) for different values of Z.
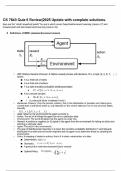
Path diagram for Moderation:
• An arrow to an arrow: the arrow from Z
converges on the arrow of X-Y
• The dotted arrow from Z-Y is absolutely
necessary!!
• Saying that Z moderates the X-Y
relationship is the same as saying that X
moderates Z-Y relationship (because
symmetric)
• It is arbitrary whether we call Z or X the moderator because the interaction is symmetric
Moderator= a variable that modifies the relationship between 2 other variables. → sounds like
interactions in ANOVA!
• An interaction in ANOVA suggests differences between differences; this is indicated by non-
parallel lines.
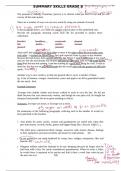
Example: the effect of a stressor (X) on depression (Y) is
stronger for low social support than when medium or high
social support is present (Z).
• Social support acts as a moderator!
There are 4 main cases in moderation that are based on the
measurement levels of X,Y and Z.
1. X and Z both interval → regression analysis
2. X nominal; Z interval → ANCOVA
3. X interval; Z nominal → ANCOVA
4. X and Z both nominal → ANOVA
(in this course Y is always interval. X and Z will be either nominal or interval)
Case 1. Interactions in regression analysis *
• A standard regression model for 2 or more predictors is a main effects only model.
• (1) 𝑌̂ = b0 + b1X + b2Z
o There are no interactions in the above formula. So we will rewrite the model for
different values of Z:
• 𝑌 = (b0 + b2Z) + b1X
̂
o Z = 0 Y = b0 + b1X
o Z = 1 Y = (b0 + b2 ) + b1X
o Z = 2 Y = (b0 + 2b2 ) + b1X (and so on…)
2
, • We have different constants, but identical regression
weights (same X-Y regression slope for all values of Z) as
indicated by parallel lines.
Now we need to add the interaction term.
We add a product term to the regression equation such that:
• (2) 𝑌̂ = b0 + b1 X + b2 Z + b3 XZ
• ‘b3 XZ’ is the test of the interaction between X and Z
• Testing b3=0 is test for interaction
We must rewrite equation 2 for different values of Z
• (3) 𝑌̂ = (b0 + b2 Z) + (b1 + b3 Z) X
o Z = 0 Y = b0 + b1 X
o Z = 1 Y = (b0 + b2 ) + (b1 + b3 ) X
o Z = 2 Y = (b0 + 2b2 ) + (b1 + 2b3 ) X (and so on…)
This does not only give different constants (b0 + b2 Z), but also different regression weights (b1 + b3 Z) for
each possible value of Z. This means we now have non-parallel regression lines → interaction. (slopes
are different!)
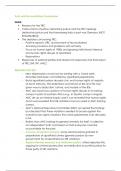
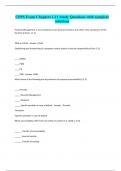
Graphical representation of interaction:
o We can draw some regression lines (X-Y) for different values of Z.
o Choosing values of Z depends on your research purposes. If you have no
a priori preferences, the conventional approach is to impute values for Z that
are 1 SD below the mean, 1 SD above the mean, and the mean:
▪ MZ – SD, MZ, MZ+ SD
o Can see that this yields non-parallel lines.
You should only choose regression lines that are within the observed range
of Z. All these regression lines go through one same single point (P).
Important to remember:
• The interaction via XZ terms is called a linear-by-linear
interaction because it describes a linear relation
between Z and the regression weight for the X-Y relationship (aka the slope aka how much the
moderator strengthens/weakens the X-Y association).
• The XZ product alone is NOT the interaction!!! It only becomes the interaction when the lower-
order effects of X and Z are also in the regression equation.
• When computing interactions, ALWAYS (!!!) include all relevant lower order effects (also in
AN(C)OVA).
3
, Centering XZ
• Not crucial, but it is convenient to center XZ.
• There are 2 reasons, the second is more important.
1. Prevents multicollinearity → XZ is usually highly correlated with X and Z. Centering lowers this
correlation.
2. Interpretation of main effects → after centering, b1 gives the effect of X on Y for the mean of Z.
Thus, it gives the approximately average effect of X on Y.
Without centering, when b3≠0, regression weight b1 refers to the specific effect of X on Y at Z=0. This is
often unnatural and out of range.
(Don’t bother centering the dependent variable- it is useless)
Testing the interaction
• The interaction is tested hierarchically
• Model 1 : X,Z → Y
• Model 2: X, Z, XZ → Y
• If b3 (the regression weight for XZ in model 2), is not significant, we stick to the more simple model
which is model 1. (basically no significant moderator effect)
What does this analysis look like in SPSS and how can we interpret the output?
• Suppose you have centered your variables and the interaction term in SPSS. You now want to
perform a hierarchical regression analysis with DEPRESSION as the outcome variable, CWSTRESS
and CSOSUWOR as predictors in Block 1, to which CINTER is added in Block 2.
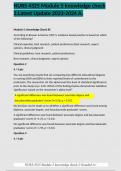
Output:
• Both analyses are highly significant, with 15.5% and 20.5% variance explained.
• The interaction term in block 2 adds 5% of explained variance, which is significant F(1,76) =4.82,
p<.05.
To make a more substantial conclusion about the effects of each variable and the interaction term on
DEPRESSION, we need to evaluate the regression weights.
4
1
,Moderation and Mediation- Lecture 1: Moderation
• In moderation and mediation there is an independent variable (X) that predicts a dependent
variable (Y) and a third variable (Z), which qualifies (moderation) or explains (mediation) the
relationship between X and Y.
• The X-Y relationship is different (stronger/weaker, or different sign(+/-)) for different values of Z.
Path diagram for Moderation:
• An arrow to an arrow: the arrow from Z
converges on the arrow of X-Y
• The dotted arrow from Z-Y is absolutely
necessary!!
• Saying that Z moderates the X-Y
relationship is the same as saying that X
moderates Z-Y relationship (because
symmetric)
• It is arbitrary whether we call Z or X the moderator because the interaction is symmetric
Moderator= a variable that modifies the relationship between 2 other variables. → sounds like
interactions in ANOVA!
• An interaction in ANOVA suggests differences between differences; this is indicated by non-
parallel lines.
Example: the effect of a stressor (X) on depression (Y) is
stronger for low social support than when medium or high
social support is present (Z).
• Social support acts as a moderator!
There are 4 main cases in moderation that are based on the
measurement levels of X,Y and Z.
1. X and Z both interval → regression analysis
2. X nominal; Z interval → ANCOVA
3. X interval; Z nominal → ANCOVA
4. X and Z both nominal → ANOVA
(in this course Y is always interval. X and Z will be either nominal or interval)
Case 1. Interactions in regression analysis *
• A standard regression model for 2 or more predictors is a main effects only model.
• (1) 𝑌̂ = b0 + b1X + b2Z
o There are no interactions in the above formula. So we will rewrite the model for
different values of Z:
• 𝑌 = (b0 + b2Z) + b1X
̂
o Z = 0 Y = b0 + b1X
o Z = 1 Y = (b0 + b2 ) + b1X
o Z = 2 Y = (b0 + 2b2 ) + b1X (and so on…)
2
, • We have different constants, but identical regression
weights (same X-Y regression slope for all values of Z) as
indicated by parallel lines.
Now we need to add the interaction term.
We add a product term to the regression equation such that:
• (2) 𝑌̂ = b0 + b1 X + b2 Z + b3 XZ
• ‘b3 XZ’ is the test of the interaction between X and Z
• Testing b3=0 is test for interaction
We must rewrite equation 2 for different values of Z
• (3) 𝑌̂ = (b0 + b2 Z) + (b1 + b3 Z) X
o Z = 0 Y = b0 + b1 X
o Z = 1 Y = (b0 + b2 ) + (b1 + b3 ) X
o Z = 2 Y = (b0 + 2b2 ) + (b1 + 2b3 ) X (and so on…)
This does not only give different constants (b0 + b2 Z), but also different regression weights (b1 + b3 Z) for
each possible value of Z. This means we now have non-parallel regression lines → interaction. (slopes
are different!)
Graphical representation of interaction:
o We can draw some regression lines (X-Y) for different values of Z.
o Choosing values of Z depends on your research purposes. If you have no
a priori preferences, the conventional approach is to impute values for Z that
are 1 SD below the mean, 1 SD above the mean, and the mean:
▪ MZ – SD, MZ, MZ+ SD
o Can see that this yields non-parallel lines.
You should only choose regression lines that are within the observed range
of Z. All these regression lines go through one same single point (P).
Important to remember:
• The interaction via XZ terms is called a linear-by-linear
interaction because it describes a linear relation
between Z and the regression weight for the X-Y relationship (aka the slope aka how much the
moderator strengthens/weakens the X-Y association).
• The XZ product alone is NOT the interaction!!! It only becomes the interaction when the lower-
order effects of X and Z are also in the regression equation.
• When computing interactions, ALWAYS (!!!) include all relevant lower order effects (also in
AN(C)OVA).
3
, Centering XZ
• Not crucial, but it is convenient to center XZ.
• There are 2 reasons, the second is more important.
1. Prevents multicollinearity → XZ is usually highly correlated with X and Z. Centering lowers this
correlation.
2. Interpretation of main effects → after centering, b1 gives the effect of X on Y for the mean of Z.
Thus, it gives the approximately average effect of X on Y.
Without centering, when b3≠0, regression weight b1 refers to the specific effect of X on Y at Z=0. This is
often unnatural and out of range.
(Don’t bother centering the dependent variable- it is useless)
Testing the interaction
• The interaction is tested hierarchically
• Model 1 : X,Z → Y
• Model 2: X, Z, XZ → Y
• If b3 (the regression weight for XZ in model 2), is not significant, we stick to the more simple model
which is model 1. (basically no significant moderator effect)
What does this analysis look like in SPSS and how can we interpret the output?
• Suppose you have centered your variables and the interaction term in SPSS. You now want to
perform a hierarchical regression analysis with DEPRESSION as the outcome variable, CWSTRESS
and CSOSUWOR as predictors in Block 1, to which CINTER is added in Block 2.
Output:
• Both analyses are highly significant, with 15.5% and 20.5% variance explained.
• The interaction term in block 2 adds 5% of explained variance, which is significant F(1,76) =4.82,
p<.05.
To make a more substantial conclusion about the effects of each variable and the interaction term on
DEPRESSION, we need to evaluate the regression weights.
4