PCA
First step to look at your data
-> reasons to do PCA
Dimension reduction
Visual and mathematical results
What are the underlying dynamics of my system?
Is there different groupd in my samples?
QC
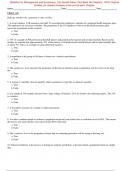
Multivariate data = short and wide table with too many variables for a
clear overview
-> complex data, how to represent this data
Data transformation: variables need to be preprocessed before being of
use
Log transformation (take the log of each datapoint)
Normalization: sometimes you need to normalize the values of a
variable-> make variables comparable
Comparison between variables: when you use patterns, outliers become
visible which would be not the case when you would look at the individual
plots
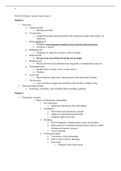
Covariance = how much do two variables change together? Can take up
any value
0 = no relation between the variables
+ = similar behaviour
- = inverted behaviour
Correlation = measures both the strength and direction of the linear
relationship between two variables. It is a normalized version of
covariance. -1 1
0 = no correlation
-1 = perfect inverted correlation
, 1 = perfect correlation
Causation = change in one variable means a direct change in the other
variable
Compare set of sick people with set of healthy people
-> find the variables correlated with the disease
-> you find factors that are not directed related to the disease but are a
consequence of the disease
Data projection
Multivariate analysis by projection: why?
-> looks at all the variables together
-> avoid loss of information
-> find underlying trends
-> more stable models
-> unsupervised
What is a projection:
You want to reduce dimensionality of the data + algebraic interpretation
(summary of observation variables into a few new artificial variables
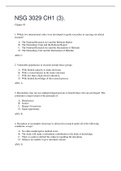
Geometric interpretation:
Variables form axes in a multidimensional space
A single observation in this space = a point
These points will be projected on a plane
Why would you use projections?
-> reduce dimensionality without the loss of information
-> handle different types of data sets
-> handles correlation variables
-> graphical results
-> separates actual trends from noise
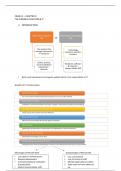
PCA
-> data visualization and simplification
Info stays in the correlation structure of the data
Projection to a lower dimensionality
First step to look at your data
-> reasons to do PCA
Dimension reduction
Visual and mathematical results
What are the underlying dynamics of my system?
Is there different groupd in my samples?
QC
Multivariate data = short and wide table with too many variables for a
clear overview
-> complex data, how to represent this data
Data transformation: variables need to be preprocessed before being of
use
Log transformation (take the log of each datapoint)
Normalization: sometimes you need to normalize the values of a
variable-> make variables comparable
Comparison between variables: when you use patterns, outliers become
visible which would be not the case when you would look at the individual
plots
Covariance = how much do two variables change together? Can take up
any value
0 = no relation between the variables
+ = similar behaviour
- = inverted behaviour
Correlation = measures both the strength and direction of the linear
relationship between two variables. It is a normalized version of
covariance. -1 1
0 = no correlation
-1 = perfect inverted correlation
, 1 = perfect correlation
Causation = change in one variable means a direct change in the other
variable
Compare set of sick people with set of healthy people
-> find the variables correlated with the disease
-> you find factors that are not directed related to the disease but are a
consequence of the disease
Data projection
Multivariate analysis by projection: why?
-> looks at all the variables together
-> avoid loss of information
-> find underlying trends
-> more stable models
-> unsupervised
What is a projection:
You want to reduce dimensionality of the data + algebraic interpretation
(summary of observation variables into a few new artificial variables
Geometric interpretation:
Variables form axes in a multidimensional space
A single observation in this space = a point
These points will be projected on a plane
Why would you use projections?
-> reduce dimensionality without the loss of information
-> handle different types of data sets
-> handles correlation variables
-> graphical results
-> separates actual trends from noise
PCA
-> data visualization and simplification
Info stays in the correlation structure of the data
Projection to a lower dimensionality