INTRO TO MARKETING RESEARCH
1. INTRODUCTION (LECTURE)
Course objectives: develop..
Knowledge:
o Theoretical: be able to describe objectives and principles, test assumptions, and interpret
outcomes of multivariate methods dealt with in the course
o Marketing: be able to identify methods useful to solve a given marketing problem, and assess
managerial implications
Skills: be able to apply multivariate methods/solve marketing problems using SPSS
HBBA: CHAPTER 1
1.1 Defining Multivariate Analysis
HBBA: ‘Broadly speaking, it refers to all statistical methods that simultaneously analyze multiple measurements
on each individual or object under investigation’
Multiple measurements measure different types of variables.
1.2 Some Basic Concepts
Measurement scales:
Nonmetric scales:
o Nominal Characteristics: unique definition/identification classification. Phenomena: e.g.
brand name, gender, student ANR. Appropriate Methods of Analysis/Statistics: e.g. %, Chi
square test. Example: Shampoo Brand Identification: Pantene 1, Elvive 2, Etos 3
o Ordinal Characteristics: indicate ‘order’, sequence. Phenomena: e.g. preference ranking,
level of education (ranking 1 is more than the other). Appropriate methods of
analysis/statistics: percentiles, median (in the middle), rank correlation + all previous statistics.
Example: Shampoo Brand Preference Etos 3 (least preferred) < Elvive 2 < Pantene 1
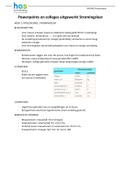
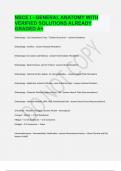
Example: Shopping frequency
= ordinal scale gives you one unit difference. 3th column: actual frequency.
Ordinal scale tells you which one is more or less, but not how much more or less.
Metric scales:
Interval Characteristics: arbitrary origin. Phenomena: e.g. attribute scores, price index. Appropriate
Methods of analysis: arithmetic average, range, standard deviation, product-moment correlation, +
previous methods. Example: Shampoo Brand Quality score Pantene 95, Elvive 90, Etos 49. Lowest =
0, highest = 100. Gives an ordering. But we can see how much the differences are. With ordinal data,
you didn’t know that.
Ratio Characteristics: unique origin. Phenomena: e.g. age, cost, number of customers. Appropriate
methods of analysis: geometric average, coefficient of variation, + all previous methods. Example:
Shampoo Brand Price Pantene 3.75, Elvive 4.66, Etos 2.89 (Euros/300ml)
o Difference between interval and ratio? Zero = zero, clear what zero means (ratio) unique
origin.
Errors: Reliability and Validity
Reliability: is the measure ‘consistent’ correctly registered
1
, Validity: does the measure capture the concept it is supposed to measure?
Statistical Significance and Power
Hypothesis testing to examine differences. We use samples and never examine the complete
population, which can result in:
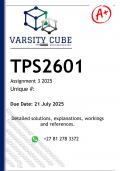
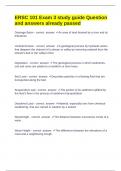
o Type I error () = probability of test showing
statistical significance when it is not present
(‘false positive’). In reality no different, test tells
you that there is a difference. (We focus on alfa!!
Alpha not higher than 5%)
o Power (1-) = probability of test showing
statistical significance when it is present. There
was a difference in reality, but your test told you
it wasn’t.
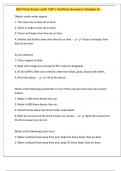
Suppose that the truth is ‘no difference’: what
would error-free population measure, lead to?
= population difference 0 no difference
Suppose that the truth is: ‘no difference’: what would sample measures, with error, lead to?
= if I move the cut-off value to the right, the alpha will decrease, and
thus the type I error risk is getting lower. You want to prevent type I
error (but change type 2 error increases).
Power probability that if there is an effect in reality and you also find an affect.
o Power depends on:
(+) larger alpha = larger power
Effect size (+) larger effect size = larger power (effect size = what you want to
measure size of correlation (for example between advertising and sales)).
Sample Size n (+) larger sample = larger power
o Implications:
Anticipate consequences of , effect and n
Assess/incorporate power when interpreting results
1.3 Types of Multivariate Methods: Dependence or Interdependence techniques
Dependence techniques:
One or more variables can be identified as dependent variables and the remaining as independent
variables.
Choice of dependence techniques depends on the number of DV’s involved in analysis.
Interdependence techniques:
Whole set of interdependent relationships is examined
2
, Further classified as having focus on variable or objects
HBBA CHAPTER 2: PRELIMINARY DATA ANALYSIS AND DATA PREPARATION
EXAM: Whatever is mention in the slides, you have to learn it in HS2, here it is very brief, but no new things.
Example “what does missing at random mean”….
2.1 Conduct preliminary analysis: graphical inspection and simple analysis
Why?
Get a feel for data
Suggest possible problems (and remedies) in next steps
How?
Univariate profiling
Bivariate analysis
2.2 Detect outliers
What are outliers? “Observations with a unique combination of characteristics
identifiable as distinctly different from the other observations”
Outliers:
There are two basic types of outliers:
o ‘Good’: true value (probably) – not errors/mistakes, real values that gives variation.
o ‘Bad’: something is wrong? ( in many cases)
To distinguish these types, one should investigate the causes
o Procedural error
o Exceptional circumstances (Cause known or unknown)
3
1. INTRODUCTION (LECTURE)
Course objectives: develop..
Knowledge:
o Theoretical: be able to describe objectives and principles, test assumptions, and interpret
outcomes of multivariate methods dealt with in the course
o Marketing: be able to identify methods useful to solve a given marketing problem, and assess
managerial implications
Skills: be able to apply multivariate methods/solve marketing problems using SPSS
HBBA: CHAPTER 1
1.1 Defining Multivariate Analysis
HBBA: ‘Broadly speaking, it refers to all statistical methods that simultaneously analyze multiple measurements
on each individual or object under investigation’
Multiple measurements measure different types of variables.
1.2 Some Basic Concepts
Measurement scales:
Nonmetric scales:
o Nominal Characteristics: unique definition/identification classification. Phenomena: e.g.
brand name, gender, student ANR. Appropriate Methods of Analysis/Statistics: e.g. %, Chi
square test. Example: Shampoo Brand Identification: Pantene 1, Elvive 2, Etos 3
o Ordinal Characteristics: indicate ‘order’, sequence. Phenomena: e.g. preference ranking,
level of education (ranking 1 is more than the other). Appropriate methods of
analysis/statistics: percentiles, median (in the middle), rank correlation + all previous statistics.
Example: Shampoo Brand Preference Etos 3 (least preferred) < Elvive 2 < Pantene 1
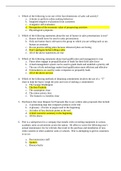
Example: Shopping frequency
= ordinal scale gives you one unit difference. 3th column: actual frequency.
Ordinal scale tells you which one is more or less, but not how much more or less.
Metric scales:
Interval Characteristics: arbitrary origin. Phenomena: e.g. attribute scores, price index. Appropriate
Methods of analysis: arithmetic average, range, standard deviation, product-moment correlation, +
previous methods. Example: Shampoo Brand Quality score Pantene 95, Elvive 90, Etos 49. Lowest =
0, highest = 100. Gives an ordering. But we can see how much the differences are. With ordinal data,
you didn’t know that.
Ratio Characteristics: unique origin. Phenomena: e.g. age, cost, number of customers. Appropriate
methods of analysis: geometric average, coefficient of variation, + all previous methods. Example:
Shampoo Brand Price Pantene 3.75, Elvive 4.66, Etos 2.89 (Euros/300ml)
o Difference between interval and ratio? Zero = zero, clear what zero means (ratio) unique
origin.
Errors: Reliability and Validity
Reliability: is the measure ‘consistent’ correctly registered
1
, Validity: does the measure capture the concept it is supposed to measure?
Statistical Significance and Power
Hypothesis testing to examine differences. We use samples and never examine the complete
population, which can result in:
o Type I error () = probability of test showing
statistical significance when it is not present
(‘false positive’). In reality no different, test tells
you that there is a difference. (We focus on alfa!!
Alpha not higher than 5%)
o Power (1-) = probability of test showing
statistical significance when it is present. There
was a difference in reality, but your test told you
it wasn’t.
Suppose that the truth is ‘no difference’: what
would error-free population measure, lead to?
= population difference 0 no difference
Suppose that the truth is: ‘no difference’: what would sample measures, with error, lead to?
= if I move the cut-off value to the right, the alpha will decrease, and
thus the type I error risk is getting lower. You want to prevent type I
error (but change type 2 error increases).
Power probability that if there is an effect in reality and you also find an affect.
o Power depends on:
(+) larger alpha = larger power
Effect size (+) larger effect size = larger power (effect size = what you want to
measure size of correlation (for example between advertising and sales)).
Sample Size n (+) larger sample = larger power
o Implications:
Anticipate consequences of , effect and n
Assess/incorporate power when interpreting results
1.3 Types of Multivariate Methods: Dependence or Interdependence techniques
Dependence techniques:
One or more variables can be identified as dependent variables and the remaining as independent
variables.
Choice of dependence techniques depends on the number of DV’s involved in analysis.
Interdependence techniques:
Whole set of interdependent relationships is examined
2
, Further classified as having focus on variable or objects
HBBA CHAPTER 2: PRELIMINARY DATA ANALYSIS AND DATA PREPARATION
EXAM: Whatever is mention in the slides, you have to learn it in HS2, here it is very brief, but no new things.
Example “what does missing at random mean”….
2.1 Conduct preliminary analysis: graphical inspection and simple analysis
Why?
Get a feel for data
Suggest possible problems (and remedies) in next steps
How?
Univariate profiling
Bivariate analysis
2.2 Detect outliers
What are outliers? “Observations with a unique combination of characteristics
identifiable as distinctly different from the other observations”
Outliers:
There are two basic types of outliers:
o ‘Good’: true value (probably) – not errors/mistakes, real values that gives variation.
o ‘Bad’: something is wrong? ( in many cases)
To distinguish these types, one should investigate the causes
o Procedural error
o Exceptional circumstances (Cause known or unknown)
3