METHODS OF COMMUNICATION RESEARCH AND STATISTIC
WEEK 5B: CORRELATION AND SIMPLE REGRESSION ANALYSIS
Correlation
Correlation is a way of measuring the extent to which two variables are related; a measure of
the degree of association among variables.
● Indicates whether a variable changes in a predictable manner as another variable
changes (covariance)
● Examines whether as one variable increases, the other variable increases, decreases or
stays the same (direction)
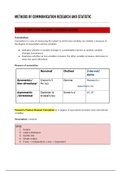
Measure of association
Pearson's Product Moment Correlation (r) is degree of association between two interval/ratio
variables.
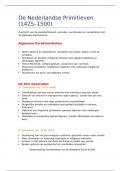
Assumption: Linearity
SPSS
1. Graphs
2. Legacy Dialogues
3. Scatter Dot
4. Simple scatter
5. X axis → independent, y axis → dependent
, 6. Element → fit line at total (linear)
SPSS
1. Analyze
2. Correlate
3. Bivariate
4. Assign variables
5. Check Pearson’s
6. Check two-tailed
If p-value < 0.05 = Statistical significance
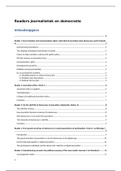
Strength of the association:
● Vary from ‐1 through 0 to +1
● 0 = no correlation
● ‐1 or +1 = perfect correlation
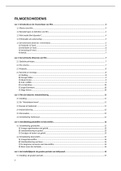
Sign of the correlation indicates direction of the relationship:
● Positive correlation (+) as one variable increases in value so does the other or if one
decreases in value so does the other
, ● Negative correlation (-) as one variable increases in value the other decreases or vice
versa
Conclusion
“A Pearson correlation analysis revealed a significant moderate positive relationship between
the extent to which concert visitors like the support act and the extent to which they like the
band, r = .45, p < .001. The more one likes the support act, the more one likes the band, and
vice versa. The null hypothesis is rejected.”
If the relationship is non-linear (has an ordinal variable)? Use Spearman's rho
SPSS
7. Analyze
8. Correlate
9. Bivariate
10. Assign variables
11. Check Spearman’s Rho
12. Check two-tailed
Conclusion
“A Spearman’s correlation analysis revealed a s ignificant moderate positive relationship
between the r anked english mark and the r anked maths mark, r = 0.67, p<0.05”
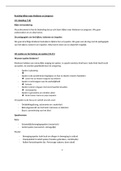
Regression Analysis
In statistical modeling, regression analysis is a set of statistical processes for estimating the
relationships among variables. It fits a linear model to our data and uses it to predict values of
an outcome variable from predictor variables.
1) Refers to asymmetrical relationships
2) When you know what the predictor and outcome variable is
WEEK 5B: CORRELATION AND SIMPLE REGRESSION ANALYSIS
Correlation
Correlation is a way of measuring the extent to which two variables are related; a measure of
the degree of association among variables.
● Indicates whether a variable changes in a predictable manner as another variable
changes (covariance)
● Examines whether as one variable increases, the other variable increases, decreases or
stays the same (direction)
Measure of association
Pearson's Product Moment Correlation (r) is degree of association between two interval/ratio
variables.
Assumption: Linearity
SPSS
1. Graphs
2. Legacy Dialogues
3. Scatter Dot
4. Simple scatter
5. X axis → independent, y axis → dependent
, 6. Element → fit line at total (linear)
SPSS
1. Analyze
2. Correlate
3. Bivariate
4. Assign variables
5. Check Pearson’s
6. Check two-tailed
If p-value < 0.05 = Statistical significance
Strength of the association:
● Vary from ‐1 through 0 to +1
● 0 = no correlation
● ‐1 or +1 = perfect correlation
Sign of the correlation indicates direction of the relationship:
● Positive correlation (+) as one variable increases in value so does the other or if one
decreases in value so does the other
, ● Negative correlation (-) as one variable increases in value the other decreases or vice
versa
Conclusion
“A Pearson correlation analysis revealed a significant moderate positive relationship between
the extent to which concert visitors like the support act and the extent to which they like the
band, r = .45, p < .001. The more one likes the support act, the more one likes the band, and
vice versa. The null hypothesis is rejected.”
If the relationship is non-linear (has an ordinal variable)? Use Spearman's rho
SPSS
7. Analyze
8. Correlate
9. Bivariate
10. Assign variables
11. Check Spearman’s Rho
12. Check two-tailed
Conclusion
“A Spearman’s correlation analysis revealed a s ignificant moderate positive relationship
between the r anked english mark and the r anked maths mark, r = 0.67, p<0.05”
Regression Analysis
In statistical modeling, regression analysis is a set of statistical processes for estimating the
relationships among variables. It fits a linear model to our data and uses it to predict values of
an outcome variable from predictor variables.
1) Refers to asymmetrical relationships
2) When you know what the predictor and outcome variable is