Factor analysis & sampling lectures 4-5
Lecture 4 - Factor Analysis
Validation of multiple item scales implies
● Questions related to the same construct should be part of the same factor.
→ Convergent validity
● Questions related to different constructs should be part of different factors.
→ Discriminant validity
Correlation analysis
Correlation measures the strength and direction of a relationship between two metric variables.
● the existence of a positive correlation of x and y does not mean that it is the increase in x
which leads to an increase in y, but only that the two variables move together (to some
extent)
Pearson’s Sample Correlation Coefficient, r, measures the direction and the strength of the linear
association between two numerical paired variables.
● You could use a Pearson’s correlation to understand whether there is an association between
exam performance and time spent revising. For example,
do I get a higher grade if I revise the exam material
multiple times?
The correlation coefficient can only be between -1 to 1.
Correlation is symmetric, so that rxy = ryx
In the figure at the right, you see the formula 1for calculating the
correlation coefficient.
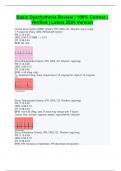
Interpreting SPSS output related to the
Pearson correlation coefficient test. Here you
test whether the correlation coefficient is
significantly different from 0 (null
hypothesis). In the following example we
analyse the SPSS output of two variables:
Jumping Distance & Height.
1
You don’t need to learn the formulas by heart, however you should be able to recognize which formula relates
to what test. For example, the r stands for correlation.
1
, Analysis of the output
● When Pearson’s r is close to 1, it means that there is a strong relationship between the two
variables. This means that changes in one variable are strongly correlated with changes in the
second variable. In our example, Pearson’s r is 0.706. This number is moderately close to 1.
For this reason, we can conclude that there is a strong relationship between our jumping
distance and height variables. However, we cannot make any other conclusions about this
relationship, based on this number.
● After interpreting the Pearson correlation, the question remains, ‘how significant is the
correlation?’ For this we look at the sig. (two-tailed) in the output.
The alpha in this example (two-tailed) is 0.01, which means that the alpha for one tail is equal
to 0.01/2 = 0.005. We will reject our null hypothesis if our one-tailed p-value is lower than
our one-tailed alpha. The p-value given in the output is also two-tailed, in order to convert
this to one tail, you simply divide it by 2 → 0.0025
In this example we reject our null hypothesis (r ≠ 0) and that there is a statistically
significant correlation between the two variables jumping distant and height.
Factor analysis
Basic concept of factor analysis
● Factor analysis is used for data reduction and summarization.
● the data reduction is accomplished by identifying groups of items or variables that are related
and combine them to create new factors
● no distinction made between dependent and independent variables
● only used with metric variables (interval, ratio)
● use factor analysis to identify underlying dimensions that explain the correlations among a
set of variables or items and to identify a smaller set of uncorrelated variables
● Factor analysis is based on inter-item correlations: when some items/variables are highly
correlated, they are assigned to one factor.
In my own words: the aim of factor analysis is to assess the reliability and validity of our
measurement scales.
Factor → is an underlying dimension that explains the correlations among a set of variables or items.
Stepwise approach to factor analysis (8 steps)
1. formulate the problem
2. construct the correlation matrix
● assess discriminant validity
Items of different multi-item scales correlate weakly
● assess convergent validity
Items belonging to one multi-item scales correlate highly
2
Lecture 4 - Factor Analysis
Validation of multiple item scales implies
● Questions related to the same construct should be part of the same factor.
→ Convergent validity
● Questions related to different constructs should be part of different factors.
→ Discriminant validity
Correlation analysis
Correlation measures the strength and direction of a relationship between two metric variables.
● the existence of a positive correlation of x and y does not mean that it is the increase in x
which leads to an increase in y, but only that the two variables move together (to some
extent)
Pearson’s Sample Correlation Coefficient, r, measures the direction and the strength of the linear
association between two numerical paired variables.
● You could use a Pearson’s correlation to understand whether there is an association between
exam performance and time spent revising. For example,
do I get a higher grade if I revise the exam material
multiple times?
The correlation coefficient can only be between -1 to 1.
Correlation is symmetric, so that rxy = ryx
In the figure at the right, you see the formula 1for calculating the
correlation coefficient.
Interpreting SPSS output related to the
Pearson correlation coefficient test. Here you
test whether the correlation coefficient is
significantly different from 0 (null
hypothesis). In the following example we
analyse the SPSS output of two variables:
Jumping Distance & Height.
1
You don’t need to learn the formulas by heart, however you should be able to recognize which formula relates
to what test. For example, the r stands for correlation.
1
, Analysis of the output
● When Pearson’s r is close to 1, it means that there is a strong relationship between the two
variables. This means that changes in one variable are strongly correlated with changes in the
second variable. In our example, Pearson’s r is 0.706. This number is moderately close to 1.
For this reason, we can conclude that there is a strong relationship between our jumping
distance and height variables. However, we cannot make any other conclusions about this
relationship, based on this number.
● After interpreting the Pearson correlation, the question remains, ‘how significant is the
correlation?’ For this we look at the sig. (two-tailed) in the output.
The alpha in this example (two-tailed) is 0.01, which means that the alpha for one tail is equal
to 0.01/2 = 0.005. We will reject our null hypothesis if our one-tailed p-value is lower than
our one-tailed alpha. The p-value given in the output is also two-tailed, in order to convert
this to one tail, you simply divide it by 2 → 0.0025
In this example we reject our null hypothesis (r ≠ 0) and that there is a statistically
significant correlation between the two variables jumping distant and height.
Factor analysis
Basic concept of factor analysis
● Factor analysis is used for data reduction and summarization.
● the data reduction is accomplished by identifying groups of items or variables that are related
and combine them to create new factors
● no distinction made between dependent and independent variables
● only used with metric variables (interval, ratio)
● use factor analysis to identify underlying dimensions that explain the correlations among a
set of variables or items and to identify a smaller set of uncorrelated variables
● Factor analysis is based on inter-item correlations: when some items/variables are highly
correlated, they are assigned to one factor.
In my own words: the aim of factor analysis is to assess the reliability and validity of our
measurement scales.
Factor → is an underlying dimension that explains the correlations among a set of variables or items.
Stepwise approach to factor analysis (8 steps)
1. formulate the problem
2. construct the correlation matrix
● assess discriminant validity
Items of different multi-item scales correlate weakly
● assess convergent validity
Items belonging to one multi-item scales correlate highly
2