Summary statsttis syllabus
Chapter 1
Variables
Various types:
Qualitative nominal and ordinal
o Also called categorical or discrete
Quantitative interval and ratio
o Also called continuous variable can take any number
Frequentiy table
To summarize e.g. scores of students
Vertically columns
Horizontally rows
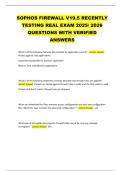
Bar tihart
Graph with frequency/count on vertical aais and scores on horizontal aais
Blank between each bar the bar can be assigned to e.g. any political party, so
there is a blank between each pair of bars and the distance between the bars has no
meaning
Often used to summarize outcome of qualitatve variable
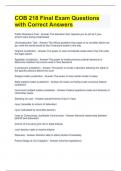
Histogram
For summarizing quantitative variables
No space between bars scores are connecting as it should for interval and ratio
variables
o Each bar has surface eaactly equal to frequency of score represented by that
bar
To ensure this for a bar width other than 1, the numbers on the y-aais
have to be divided by the class width
o Horizontal end points of each bar are chosen by user determine width
For very large sample sized, percentages can be presented instead of frequencies
Boundaries
[..,..)
o [ = included in class interval
o ) = not included in class interval
Theoretti distributon
When number of classes becomes very large
obtain theoretic distribution
,Measures of tientral tendentiy
Mode
o Score with highest
frequency
Median
o Middle value
Mean
o Average
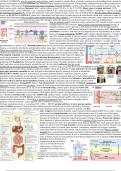
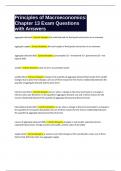
Skewness
Right skewed (+)
average is the highest
because most sensitive to
eatreme values right skew means there are more large values
Variantie
How much subjects difer from each other with regard to their scores
You can calculate how much measurements difer from the mean but then -2 and
+2 would cancel each other out you can solve this by calculating the average sum
of the quadratic diference of all values around the average variantie
8 = number of measurements
If you do not divide by N (8 in this case) statistic is called variation
o So variation = N a var(Xn)
Population vs sample:
o Population divide by N-1
o Sample divide by N
Standard deviaton
Square root of variance
More usable eapressed in same scale as value (so e.g. inches)
o Variance is not square of value, so e.g. square of inches
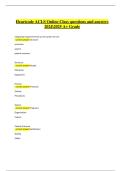
Normal distributon
Theoretic distribution
Features:
o Symmetric so average, mode and median will coincide
, o 68% of scores falls within 1 standard deviation
of average
95% will fall within 2 standard deviations
99.7% will fall within 3 standard deviations
Pearson tiorrelaton
Standardization
Covariance needs to be converted to standard set of units to avoid dependency on
measurement scale standardizaton
o Standard deviation typically used as unit
By dividing the distance from the mean by the standard deviation, you
get the distance in standard deviations
Standardized covariance is known as tiorrelaton tioeftiientt
o Sa is standard deviation of frst variable, Sy is of second variable
o Coefficient is known as Pearson product-moment correlation coefficient
o Can only be between -1 and +1
-1 = perfectly negative correlation values go in same direction
+1 = perfectly positive correlation values go in opposite direction
Other formula for Pearson tiorrelatont
Chapter 2
Linear regression
Determining the approaimately average Y value for a given Xn value
When dependent variable is quantitative
Diference correlation and regression:
Correlation is symmetric
o If Xn is correlated to Y, then Y is also correlated to Xn by the same amount
Regression is asymmetric
o Determining average Y for given Xn is diferent than determining average Xn for
given Y
Independent and dependent variables
Independent variable is a cause, value does not depend on another variable
Dependent value of variable depends on cause
Designs
Longitudinal subject measured repeatedly
, Cross-sectional only measured once no repeated measurements
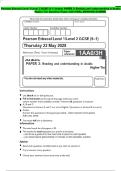
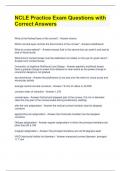
Regression line
Summarizes scatter plot by a straight line
Straight line that minimizes sum of all squared
deviations of observations from regression line
Useful for calculating e.g. predicted length for age
value
Residuals:
Deviations of observation from the regression line
Equaton
Deviaton of predicted value from observed Y^ value of
child
Least squares method
Straight line that minimizes sum of all squared deviations of observations from that
line minimizes sum of squared residuals
Regression slope:
o
Regression intercept
o
R-square
Measure of how good data can be summarized by regression line
Range is between 0 and 1
o R=1 all of total variation is eaplained by regression line
Total variaton to be explained/total variaton
Variation
Denoted as SS(Y) or SS(total)
Fraction of total variation eaplained by regression line R-square
Unexplained variaton
Denoted as SS(residual) or SS(uneaplained)
Chapter 1
Variables
Various types:
Qualitative nominal and ordinal
o Also called categorical or discrete
Quantitative interval and ratio
o Also called continuous variable can take any number
Frequentiy table
To summarize e.g. scores of students
Vertically columns
Horizontally rows
Bar tihart
Graph with frequency/count on vertical aais and scores on horizontal aais
Blank between each bar the bar can be assigned to e.g. any political party, so
there is a blank between each pair of bars and the distance between the bars has no
meaning
Often used to summarize outcome of qualitatve variable
Histogram
For summarizing quantitative variables
No space between bars scores are connecting as it should for interval and ratio
variables
o Each bar has surface eaactly equal to frequency of score represented by that
bar
To ensure this for a bar width other than 1, the numbers on the y-aais
have to be divided by the class width
o Horizontal end points of each bar are chosen by user determine width
For very large sample sized, percentages can be presented instead of frequencies
Boundaries
[..,..)
o [ = included in class interval
o ) = not included in class interval
Theoretti distributon
When number of classes becomes very large
obtain theoretic distribution
,Measures of tientral tendentiy
Mode
o Score with highest
frequency
Median
o Middle value
Mean
o Average
Skewness
Right skewed (+)
average is the highest
because most sensitive to
eatreme values right skew means there are more large values
Variantie
How much subjects difer from each other with regard to their scores
You can calculate how much measurements difer from the mean but then -2 and
+2 would cancel each other out you can solve this by calculating the average sum
of the quadratic diference of all values around the average variantie
8 = number of measurements
If you do not divide by N (8 in this case) statistic is called variation
o So variation = N a var(Xn)
Population vs sample:
o Population divide by N-1
o Sample divide by N
Standard deviaton
Square root of variance
More usable eapressed in same scale as value (so e.g. inches)
o Variance is not square of value, so e.g. square of inches
Normal distributon
Theoretic distribution
Features:
o Symmetric so average, mode and median will coincide
, o 68% of scores falls within 1 standard deviation
of average
95% will fall within 2 standard deviations
99.7% will fall within 3 standard deviations
Pearson tiorrelaton
Standardization
Covariance needs to be converted to standard set of units to avoid dependency on
measurement scale standardizaton
o Standard deviation typically used as unit
By dividing the distance from the mean by the standard deviation, you
get the distance in standard deviations
Standardized covariance is known as tiorrelaton tioeftiientt
o Sa is standard deviation of frst variable, Sy is of second variable
o Coefficient is known as Pearson product-moment correlation coefficient
o Can only be between -1 and +1
-1 = perfectly negative correlation values go in same direction
+1 = perfectly positive correlation values go in opposite direction
Other formula for Pearson tiorrelatont
Chapter 2
Linear regression
Determining the approaimately average Y value for a given Xn value
When dependent variable is quantitative
Diference correlation and regression:
Correlation is symmetric
o If Xn is correlated to Y, then Y is also correlated to Xn by the same amount
Regression is asymmetric
o Determining average Y for given Xn is diferent than determining average Xn for
given Y
Independent and dependent variables
Independent variable is a cause, value does not depend on another variable
Dependent value of variable depends on cause
Designs
Longitudinal subject measured repeatedly
, Cross-sectional only measured once no repeated measurements
Regression line
Summarizes scatter plot by a straight line
Straight line that minimizes sum of all squared
deviations of observations from regression line
Useful for calculating e.g. predicted length for age
value
Residuals:
Deviations of observation from the regression line
Equaton
Deviaton of predicted value from observed Y^ value of
child
Least squares method
Straight line that minimizes sum of all squared deviations of observations from that
line minimizes sum of squared residuals
Regression slope:
o
Regression intercept
o
R-square
Measure of how good data can be summarized by regression line
Range is between 0 and 1
o R=1 all of total variation is eaplained by regression line
Total variaton to be explained/total variaton
Variation
Denoted as SS(Y) or SS(total)
Fraction of total variation eaplained by regression line R-square
Unexplained variaton
Denoted as SS(residual) or SS(uneaplained)