Statistics I
Exam Revision
Week 1
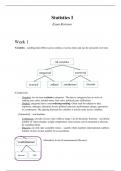
Variables – anything that differs (across entities or across time) and can be measured over time.
(Categorical)
- Nominal: two or more exclusive categories. The data in categories has no order or
ranking (eye color, marital status, hair color, political party affiliation).
- Ordinal: categories have a real ordering/ranking. Often used for subjective data
(opinions, attitudes, education levels, political interests, performance ratings, agreement
to a statement). The spacing between the variables is not the same across variables.
(Numerical) – real numbers
- Continuous: can take on any value within a range. Can be decimals, fractions – an infinite
number of values (height, weight, temperature, time) (some can be measured as discrete,
by rounding them).
- Discrete: can only take countable values – usually whole numbers (international conflicts,
number of pets owned, number of car accidents).
Alternative levels of measurement (Stevens):
,Interval: the zero is arbitrary/meaningless (temperature, like 0C does not mean an absence of
anything, pH (pH=0 does not mean absence of anything), IQ scores
Ratio: the zero is meaningful (salary, 0K, number of international conflicts)
Independent variable: causes, x, has an effect on the DV
Dependent variable: outcomes, y
Measures of central tendency
When we collect data, we can show ow the data is distributed in comparison to other values.
This is frequency distribution, it shows all the intervals, and how often they occur.
Uniform – every outcome has a roughly equal chance of happening
Multimodal – more than 2 likely values
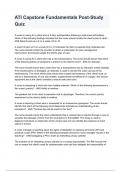
Skewness: a distribution can skew to the right or left, positive of negative skew, respectively.
This depends on where the mass “tail” is longest. Long tail on the right = skewed right.
Measure of central tendency: single value that attempts to describe a set of data by identifying
the central position within that set. For example, mean, median and mode.
Measures of dispersion: give an indication of how stretched the data set is.
, - Mode: most frequent score in a data set, that with most frequencies. There can be several
modes, when the frequencies for two categories are the same.
- Median: the middle score for a data set, arranged in order of magnitude. Then, we find
the value in the middle, in the order. With an even number of scores, we just add the two
in middle, and divide them by two: constructing a new middle point.
- Mean: the mean is calculated by adding up every value in a variable, and divide by the
number of observations (n). When there are extreme values, the median may be more
useful, because the mean is sensitive to extreme values, and the median isn’t.
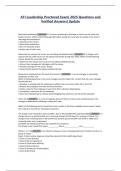
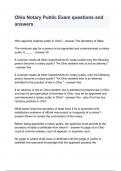
How to calculate the standard deviation given the sum of all squared errors?
First, we calculate the sum of all squared errors by taking each individual observation and
subtracting it from the mean. Then, squaring each of the differences, and adding them all up.
(mean = 11.44. X1 = 3
11.44 – 3 = -8.44
-8.44^2 = 71.2336.
Do this for each X, and then add everything up.)
Once we have the sum of squared errors, we calculate the standard deviation using
This is similar to calculating the variance – the variance, s^2, is the same calculating without the
squared root. (The formula for standard deviation in the formula sheet is just s = sqrt(s^2) –
confusing)
Measures of dispersion
, An indicator to the extent which a distribution is stretched or squeezed.
The range is the difference between the lowest and the highest values. The highest – lower is the
range.
We can divide this into “chunks” called “quantile”. The more common quantiles are: percentiles,
deciles, quintiles, quartiles. The common range to use here is the interquartile range. This is the
range of the middle 50% of the data.
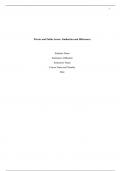
How to calculate the IQR? Calculate the median – calculate the median of the lower half
(when there is none, we calculate the sum of the two middle values/2) – do the same for the
upper half – then we can lay out the quartiles, by calculating the difference between the upper
half quartile and the lower half. The same is done with even numbers, except we do not need to
calculate the man of the middle values.
When calculating this, the IQR uses only a selection of the data. It is resistance against outliers –
a “robust” statistic.
- The deviance is used to calculate how such easy value deviates from the mean
- To calculate it, we find out how much each of the frequency deviate from the mean
- So, we need the mean
- Then, we do this for each observation: subtract the mean from the frequency
- Then we add the sum of each of these of deviances = total deviance
The total deviance is not a useful measure of spread – it usually totals to zero. We fix this by
squaring the differences.
So, we square the deviances, and we add these up. This makes every value positive (which as the
prob before, positive and negative.
Week 2
Introduction Graphs and Visualizations
The goal of data visualization to make it easier to identify patterns, data and find relations. A
good visualization shows the important features of the data.
Exam Revision
Week 1
Variables – anything that differs (across entities or across time) and can be measured over time.
(Categorical)
- Nominal: two or more exclusive categories. The data in categories has no order or
ranking (eye color, marital status, hair color, political party affiliation).
- Ordinal: categories have a real ordering/ranking. Often used for subjective data
(opinions, attitudes, education levels, political interests, performance ratings, agreement
to a statement). The spacing between the variables is not the same across variables.
(Numerical) – real numbers
- Continuous: can take on any value within a range. Can be decimals, fractions – an infinite
number of values (height, weight, temperature, time) (some can be measured as discrete,
by rounding them).
- Discrete: can only take countable values – usually whole numbers (international conflicts,
number of pets owned, number of car accidents).
Alternative levels of measurement (Stevens):
,Interval: the zero is arbitrary/meaningless (temperature, like 0C does not mean an absence of
anything, pH (pH=0 does not mean absence of anything), IQ scores
Ratio: the zero is meaningful (salary, 0K, number of international conflicts)
Independent variable: causes, x, has an effect on the DV
Dependent variable: outcomes, y
Measures of central tendency
When we collect data, we can show ow the data is distributed in comparison to other values.
This is frequency distribution, it shows all the intervals, and how often they occur.
Uniform – every outcome has a roughly equal chance of happening
Multimodal – more than 2 likely values
Skewness: a distribution can skew to the right or left, positive of negative skew, respectively.
This depends on where the mass “tail” is longest. Long tail on the right = skewed right.
Measure of central tendency: single value that attempts to describe a set of data by identifying
the central position within that set. For example, mean, median and mode.
Measures of dispersion: give an indication of how stretched the data set is.
, - Mode: most frequent score in a data set, that with most frequencies. There can be several
modes, when the frequencies for two categories are the same.
- Median: the middle score for a data set, arranged in order of magnitude. Then, we find
the value in the middle, in the order. With an even number of scores, we just add the two
in middle, and divide them by two: constructing a new middle point.
- Mean: the mean is calculated by adding up every value in a variable, and divide by the
number of observations (n). When there are extreme values, the median may be more
useful, because the mean is sensitive to extreme values, and the median isn’t.
How to calculate the standard deviation given the sum of all squared errors?
First, we calculate the sum of all squared errors by taking each individual observation and
subtracting it from the mean. Then, squaring each of the differences, and adding them all up.
(mean = 11.44. X1 = 3
11.44 – 3 = -8.44
-8.44^2 = 71.2336.
Do this for each X, and then add everything up.)
Once we have the sum of squared errors, we calculate the standard deviation using
This is similar to calculating the variance – the variance, s^2, is the same calculating without the
squared root. (The formula for standard deviation in the formula sheet is just s = sqrt(s^2) –
confusing)
Measures of dispersion
, An indicator to the extent which a distribution is stretched or squeezed.
The range is the difference between the lowest and the highest values. The highest – lower is the
range.
We can divide this into “chunks” called “quantile”. The more common quantiles are: percentiles,
deciles, quintiles, quartiles. The common range to use here is the interquartile range. This is the
range of the middle 50% of the data.
How to calculate the IQR? Calculate the median – calculate the median of the lower half
(when there is none, we calculate the sum of the two middle values/2) – do the same for the
upper half – then we can lay out the quartiles, by calculating the difference between the upper
half quartile and the lower half. The same is done with even numbers, except we do not need to
calculate the man of the middle values.
When calculating this, the IQR uses only a selection of the data. It is resistance against outliers –
a “robust” statistic.
- The deviance is used to calculate how such easy value deviates from the mean
- To calculate it, we find out how much each of the frequency deviate from the mean
- So, we need the mean
- Then, we do this for each observation: subtract the mean from the frequency
- Then we add the sum of each of these of deviances = total deviance
The total deviance is not a useful measure of spread – it usually totals to zero. We fix this by
squaring the differences.
So, we square the deviances, and we add these up. This makes every value positive (which as the
prob before, positive and negative.
Week 2
Introduction Graphs and Visualizations
The goal of data visualization to make it easier to identify patterns, data and find relations. A
good visualization shows the important features of the data.