Lecture 1: Conceptual models & analysis of variance (ANOVA)
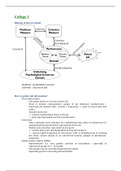
Outcome variable (OV)/ Dependent variable (DV)
test variable, to be explained
Predictor variable (PV)/ Independent variable (IV)
variable that explains
P-value = probability of obtaining a result (test-statstt valueu equal to what was attually
observed, assuming that the null hypothesis is true (no efettt relatonshipu
If the P is low H0 must go
Conceptual model = visual representaton of relatons between theorettal tonstrutts
(variablesu
Variables tan have diferent measurement stales:
Categorital (binary, nominal, ordinalu
- Can only do a tount
Quanttatve (distrete, interval, ratou
- Possible to draw averages, quartles ett.
Ordinal stales (e.g.u Likert are ofen treated as interval stales
Intome tan be quanttatve or tategorital (low, medium, highu
You base your technique on what type of variables
For most tethniques OV should be quanttatve
1. Visualize data
2. Analysis
3. Regression – fnd tauset efett
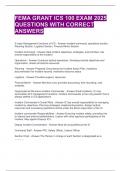
Moderation efect = efett between PV and OV is stronger in tertain setngs – moderaton
variable moderates the relaton between two other variables
e.g. sugar in tofee (PV1u only tauses sweetness (OVu when strred (PV2u
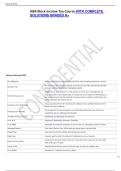
,Mediation efect = proposed relaton goes ‘via’ another variable – mediatng variable
meditates the relatonship between two other variables
1. Analysis of Variance (ANOVA)
Goal: to check whether diferences between 2 (or more groups are statistically diferent
( P-value) and how much variability in the OV can be explained by the PV.
Used when:
Outtome variable = quanttatve
Predittor variable = tategorital wt more than 2 groups
(if 2 groups – use independent t-testu
2 measurements of variability (how muth values difer in your datau
Variante = average of squared diferentes from the mean (averageu
Sum of squares = sum of squared diferentes from the mean (averageu
When dividing a tlass of students in 3 workgroups and wantng to thetk if exam results
difer per workgroup, 30% of the exam grade might be a result of whith workgroup a
student is in, 10% preparaton, 10% previous experiente ett.
Pertentages are explained by R2
Not possible to explain entire diference with one variable, always more efecting the IV
Also R2 is never 1, because impossible to fnd all the factors infuencing an IV
Assumptons
Variante is homogenous atross groups
Residuals are normally distributed
Groups are roughly equally sized
Subjetts tan only be in one group (mutually extlusiveu
For this tourse only homogeneity needs to be tested Levene’s test
P-value (Sigu > 0.05, betause you want H0 (homogeneityu to be true
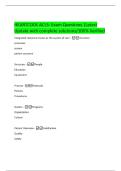
, Step 1. Chetk mean of all observatons = ý
Step 2. Total Sum Square (SStotalu = how far is eath observaton from the average
= observaton – overall mean = yi - ý
You take the square because outcome cannot be negative, then they would cancel each
other out
Step 3. Mode sum of squares (SSmodelu = diferentes between the groups
= group means – overall mean
You want this to be as high as possible
Step 4. Residual sum of squares (SSresidualu = variantet diferentes within the group
= observaton – group mean
You want this to be as low as possible
= same as error sum of squares
Step 5.
R2 = diferente between groups
variability explained by model SSmodel
R2 = =
total variability SStotal
SStotal=SSmodel+ SSresidual
x100% for percentage
Step 6.
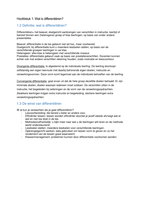
F-test = thetks if group means difer from ANOVA
explained variability between group variabiliy
F ( ratio )= =
unexplained variability within group variability
Cannot simple divide SSmodel by SSresidual betause diferent number of observatons
Therefore, divide by degrees of freedom to get the mean square
dfmodel=k−1 dfresidual=n−k
*k = number of groups
You want this to be as high as possible
Outcome variable (OV)/ Dependent variable (DV)
test variable, to be explained
Predictor variable (PV)/ Independent variable (IV)
variable that explains
P-value = probability of obtaining a result (test-statstt valueu equal to what was attually
observed, assuming that the null hypothesis is true (no efettt relatonshipu
If the P is low H0 must go
Conceptual model = visual representaton of relatons between theorettal tonstrutts
(variablesu
Variables tan have diferent measurement stales:
Categorital (binary, nominal, ordinalu
- Can only do a tount
Quanttatve (distrete, interval, ratou
- Possible to draw averages, quartles ett.
Ordinal stales (e.g.u Likert are ofen treated as interval stales
Intome tan be quanttatve or tategorital (low, medium, highu
You base your technique on what type of variables
For most tethniques OV should be quanttatve
1. Visualize data
2. Analysis
3. Regression – fnd tauset efett
Moderation efect = efett between PV and OV is stronger in tertain setngs – moderaton
variable moderates the relaton between two other variables
e.g. sugar in tofee (PV1u only tauses sweetness (OVu when strred (PV2u
,Mediation efect = proposed relaton goes ‘via’ another variable – mediatng variable
meditates the relatonship between two other variables
1. Analysis of Variance (ANOVA)
Goal: to check whether diferences between 2 (or more groups are statistically diferent
( P-value) and how much variability in the OV can be explained by the PV.
Used when:
Outtome variable = quanttatve
Predittor variable = tategorital wt more than 2 groups
(if 2 groups – use independent t-testu
2 measurements of variability (how muth values difer in your datau
Variante = average of squared diferentes from the mean (averageu
Sum of squares = sum of squared diferentes from the mean (averageu
When dividing a tlass of students in 3 workgroups and wantng to thetk if exam results
difer per workgroup, 30% of the exam grade might be a result of whith workgroup a
student is in, 10% preparaton, 10% previous experiente ett.
Pertentages are explained by R2
Not possible to explain entire diference with one variable, always more efecting the IV
Also R2 is never 1, because impossible to fnd all the factors infuencing an IV
Assumptons
Variante is homogenous atross groups
Residuals are normally distributed
Groups are roughly equally sized
Subjetts tan only be in one group (mutually extlusiveu
For this tourse only homogeneity needs to be tested Levene’s test
P-value (Sigu > 0.05, betause you want H0 (homogeneityu to be true
, Step 1. Chetk mean of all observatons = ý
Step 2. Total Sum Square (SStotalu = how far is eath observaton from the average
= observaton – overall mean = yi - ý
You take the square because outcome cannot be negative, then they would cancel each
other out
Step 3. Mode sum of squares (SSmodelu = diferentes between the groups
= group means – overall mean
You want this to be as high as possible
Step 4. Residual sum of squares (SSresidualu = variantet diferentes within the group
= observaton – group mean
You want this to be as low as possible
= same as error sum of squares
Step 5.
R2 = diferente between groups
variability explained by model SSmodel
R2 = =
total variability SStotal
SStotal=SSmodel+ SSresidual
x100% for percentage
Step 6.
F-test = thetks if group means difer from ANOVA
explained variability between group variabiliy
F ( ratio )= =
unexplained variability within group variability
Cannot simple divide SSmodel by SSresidual betause diferent number of observatons
Therefore, divide by degrees of freedom to get the mean square
dfmodel=k−1 dfresidual=n−k
*k = number of groups
You want this to be as high as possible