REGENERATING PLACES
How and why do places vary?
Regeneration Long-term upgrading of existing places including renewal schemes for urban and rural
areas
Rebranding Creating a new or enhanced identity for an area to increase its attractiveness and
socio-economic viability
Re-imaging How the image of a place is changed and portrayed in the media
Urban A built-up area which forms parts of a town or city
Rural An area of countryside
Rural-urban The unbroken transition from remote rural places to intensively used urban places
continuum
Quinary sector The highest level of decision making in an economy concentrated in STEM
employment (science, technology, engineering and mathematics)
Full time Working 35 hours or more a week
employment
Part time Working under 35 hours a week
employment
Statistical evidence about Hendon Central (local place) and Stratford New Town (contrasting
place)
Hendon Central Stratford New Town
General health 65% in very good health 43% in very good health
(DataShine)
Life expectancy (ONS) An average of 79 for males and An average of 79 for males and 82
84 for females for females
Health deprivation (IMD) 40% least health deprived 40% most health deprived
neighbourhoods in the country neighbourhoods in the country
Levels of education 46% educated to degree level 15% educated to degree level
(DataShine)
Employment deprivation 30% least employment deprived 50% most employment deprived
(IMD) neighbourhoods in the country neighbourhoods in the country
Income deprivation (IMD) 50% least income deprived 30% most income deprived
neighbourhoods in the country neighbourhoods in the country
Crime (Police Crime Between November 2017 and Between November 2017 and
Map) October 2018 413 violent and October 2018, 1514 violent and
sexual crimes were reported, an sexual crimes were reported, an
average of around 150 per average of around 600 per month
month
Quality of the living 20% most deprived 20% most deprived
environment (IMD) neighbourhood in terms of living neighbourhood in terms of living
environment environment
Derelict land (Google Minimal, predominant land uses Some derelict land, high housing
Earth) are residential and recreational density
, Deprivation means lacking something that is usually present. A community does not need to be
poor to be deprived.
Every ten years the census gives the Office for National Statistics (ONS) a complete picture of the
nation. It allows the ONS to compare different groups of people across the United Kingdom because
the same questions are asked, and the information is recorded, in the same way throughout
England, Wales, Scotland and Northern Ireland. DataShine Census displays the results of the 2011
census on maps.
The Index of Multiple Deprivation 2015 is the official measure of relative deprivation for small areas
(or neighbourhoods) in England. The Index of Multiple Deprivation ranks every small area in
England from 1 (most deprived area) to 32,844 (least deprived area). The Index of Multiple
Deprivation has seven domains comprising:
Income Deprivation Employment Deprivation Education, Skills and Training Deprivation
Health Deprivation and Disability Crime Barriers to Housing and Services Living Environment
Deprivation. Each of these domains is based on a basket of indicators. As far as is possible, each
indicator is based on data from the most recent time point available; in practice most indicators in
the Indices of Deprivation 2015 relate to the tax year 2012/13.
Overall the quality of life in Hendon Central is better than the quality of life in Stratford New
Town, however both neighbourhoods are in the 20% most deprived category in terms of
quality of the living environment.
Analysis of the statistical evidence
Professionals are more likely to be able to afford the higher house prices in Hendon. Places specialising in
modern high-value industries (such as law, insurance and finance in Hendon) will generate ‘new’ money from
their ‘exports’ and create a positive spin off or multiplies effect on other services. Contrastingly, Stratford
suffered from de-industrialisation in the 1980s.
Variations in income can affect the quality of people’s housing and diets. Black and minority ethnic (BME)
groups generally have worse health than the overall population, with one main driver being their often poorer
socio-economic position.
According to research by the Joseph Rowntree Foundation, only 14% per cent variation in and individual’s
performance is due to quality of school attended – more disadvantaged children may feel a lack of control
over their learning and may be reluctant to carry on to higher education.
Both areas are deprived in terms of the quality of the living environment. The Living Environment domain
combines 4 indicators to give an overall score for the level of deprivation in the quality of the local
environment. The indicators used in the latest update of this domain are: social and private housing in poor
condition - houses without central heating - air quality - road traffic accidents involving injury to pedestrians
and cyclists. Both Hendon and Stratford New Town have busy roads, one explanation for the poor scores.
Overall the trends reflect the greater wealth and lower deprivation of Hendon compared to Stratford New
Town.
How are inequalities in pay levels reflected in quality of life indices?
Those working in the primary sector and low-level services generally receive lower pay than
those is more skilled and professional services
There is huge disparity in incomes across the UK
In 2014 the top ten percent of employees, mainly managers, directors and senior officials,
earned over £53,000 annually.
On the other hand, the bottom ten percent of employees, mainly customers-service workers
such as carers, earned under £15,000 annually
According to the quality of life index 2015, Edinburgh is the best place to live with a high average
salary of £29,588 and the worst place to live is Bradford which has a low average salary of £16,000.
Quality of life usually rises and falls with pay levels, although this is not always the case.
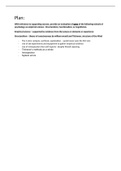
, Clark Fisher Model
Up to 1780 1780-1960 1960 onwards
The percentage of primary employment decreases as a nation develops economically
The percentage of secondary employment increases in the pre-industrial stage and falls in the
post-industrial stage
The percentage of tertiary employment increases as a nation develops economically
The quaternary employment sector emerges in the post-industrial stage but is still the smallest
How and why have the functions of Hendon Central and Stratford New
Town changed over time?
Hendon Central
In 1908 Hendon was a small agricultural village (see map). However today
Hendon is a densely populated London suburb with residential, retail and
commercial functions.
Factors responsible for this include:
Physical factors
Hendon is only 8 miles from central London, which is easily accessible by tube.
Accessibility and connectedness
Despite a rise in population, in the late 19th century, Hendon central remained relatively
unchanged until Hampstead tube reached Golders green in 1907, and Edgware in 1924.
Historical development
The area around Brent Street was covered with houses after Hendon railway station opened
in 1868. In 1876 Brent Street became a leading shopping district.
Local and national planning
How and why do places vary?
Regeneration Long-term upgrading of existing places including renewal schemes for urban and rural
areas
Rebranding Creating a new or enhanced identity for an area to increase its attractiveness and
socio-economic viability
Re-imaging How the image of a place is changed and portrayed in the media
Urban A built-up area which forms parts of a town or city
Rural An area of countryside
Rural-urban The unbroken transition from remote rural places to intensively used urban places
continuum
Quinary sector The highest level of decision making in an economy concentrated in STEM
employment (science, technology, engineering and mathematics)
Full time Working 35 hours or more a week
employment
Part time Working under 35 hours a week
employment
Statistical evidence about Hendon Central (local place) and Stratford New Town (contrasting
place)
Hendon Central Stratford New Town
General health 65% in very good health 43% in very good health
(DataShine)
Life expectancy (ONS) An average of 79 for males and An average of 79 for males and 82
84 for females for females
Health deprivation (IMD) 40% least health deprived 40% most health deprived
neighbourhoods in the country neighbourhoods in the country
Levels of education 46% educated to degree level 15% educated to degree level
(DataShine)
Employment deprivation 30% least employment deprived 50% most employment deprived
(IMD) neighbourhoods in the country neighbourhoods in the country
Income deprivation (IMD) 50% least income deprived 30% most income deprived
neighbourhoods in the country neighbourhoods in the country
Crime (Police Crime Between November 2017 and Between November 2017 and
Map) October 2018 413 violent and October 2018, 1514 violent and
sexual crimes were reported, an sexual crimes were reported, an
average of around 150 per average of around 600 per month
month
Quality of the living 20% most deprived 20% most deprived
environment (IMD) neighbourhood in terms of living neighbourhood in terms of living
environment environment
Derelict land (Google Minimal, predominant land uses Some derelict land, high housing
Earth) are residential and recreational density
, Deprivation means lacking something that is usually present. A community does not need to be
poor to be deprived.
Every ten years the census gives the Office for National Statistics (ONS) a complete picture of the
nation. It allows the ONS to compare different groups of people across the United Kingdom because
the same questions are asked, and the information is recorded, in the same way throughout
England, Wales, Scotland and Northern Ireland. DataShine Census displays the results of the 2011
census on maps.
The Index of Multiple Deprivation 2015 is the official measure of relative deprivation for small areas
(or neighbourhoods) in England. The Index of Multiple Deprivation ranks every small area in
England from 1 (most deprived area) to 32,844 (least deprived area). The Index of Multiple
Deprivation has seven domains comprising:
Income Deprivation Employment Deprivation Education, Skills and Training Deprivation
Health Deprivation and Disability Crime Barriers to Housing and Services Living Environment
Deprivation. Each of these domains is based on a basket of indicators. As far as is possible, each
indicator is based on data from the most recent time point available; in practice most indicators in
the Indices of Deprivation 2015 relate to the tax year 2012/13.
Overall the quality of life in Hendon Central is better than the quality of life in Stratford New
Town, however both neighbourhoods are in the 20% most deprived category in terms of
quality of the living environment.
Analysis of the statistical evidence
Professionals are more likely to be able to afford the higher house prices in Hendon. Places specialising in
modern high-value industries (such as law, insurance and finance in Hendon) will generate ‘new’ money from
their ‘exports’ and create a positive spin off or multiplies effect on other services. Contrastingly, Stratford
suffered from de-industrialisation in the 1980s.
Variations in income can affect the quality of people’s housing and diets. Black and minority ethnic (BME)
groups generally have worse health than the overall population, with one main driver being their often poorer
socio-economic position.
According to research by the Joseph Rowntree Foundation, only 14% per cent variation in and individual’s
performance is due to quality of school attended – more disadvantaged children may feel a lack of control
over their learning and may be reluctant to carry on to higher education.
Both areas are deprived in terms of the quality of the living environment. The Living Environment domain
combines 4 indicators to give an overall score for the level of deprivation in the quality of the local
environment. The indicators used in the latest update of this domain are: social and private housing in poor
condition - houses without central heating - air quality - road traffic accidents involving injury to pedestrians
and cyclists. Both Hendon and Stratford New Town have busy roads, one explanation for the poor scores.
Overall the trends reflect the greater wealth and lower deprivation of Hendon compared to Stratford New
Town.
How are inequalities in pay levels reflected in quality of life indices?
Those working in the primary sector and low-level services generally receive lower pay than
those is more skilled and professional services
There is huge disparity in incomes across the UK
In 2014 the top ten percent of employees, mainly managers, directors and senior officials,
earned over £53,000 annually.
On the other hand, the bottom ten percent of employees, mainly customers-service workers
such as carers, earned under £15,000 annually
According to the quality of life index 2015, Edinburgh is the best place to live with a high average
salary of £29,588 and the worst place to live is Bradford which has a low average salary of £16,000.
Quality of life usually rises and falls with pay levels, although this is not always the case.
, Clark Fisher Model
Up to 1780 1780-1960 1960 onwards
The percentage of primary employment decreases as a nation develops economically
The percentage of secondary employment increases in the pre-industrial stage and falls in the
post-industrial stage
The percentage of tertiary employment increases as a nation develops economically
The quaternary employment sector emerges in the post-industrial stage but is still the smallest
How and why have the functions of Hendon Central and Stratford New
Town changed over time?
Hendon Central
In 1908 Hendon was a small agricultural village (see map). However today
Hendon is a densely populated London suburb with residential, retail and
commercial functions.
Factors responsible for this include:
Physical factors
Hendon is only 8 miles from central London, which is easily accessible by tube.
Accessibility and connectedness
Despite a rise in population, in the late 19th century, Hendon central remained relatively
unchanged until Hampstead tube reached Golders green in 1907, and Edgware in 1924.
Historical development
The area around Brent Street was covered with houses after Hendon railway station opened
in 1868. In 1876 Brent Street became a leading shopping district.
Local and national planning