FINANCIAL
STATEMENT ANALYSIS
& VALUATION:
SUMMARY
@ECOsummaries
→ 20% discount
1
,Table of contents
Lecture 1_________________________________________________page 3-4
Practise session 1__________________________________________page 5-7
Lecture 2_________________________________________________page 8-12
Practise session 2__________________________________________page 13-15
Lecture 3_________________________________________________page 16-21
Practise session 3__________________________________________page 22-26
Lecture 4_________________________________________________page 27-30
Practise session 4__________________________________________page 31-35
Lecture 5_________________________________________________page 36-41
Practise session 5__________________________________________page 42-45
Lecture 6_________________________________________________page 36-50
Practise session 6__________________________________________page 51-53
Lecture 7_________________________________________________page 54-58
2
,Lecture 1 – Valuation drivers
Introduction:
Firm value: discounted sum of expected future cash flows (economic value)
Financial statements are not used to derive a single true/false equity value
→ Does not exist!
Accounting: language to measure and communicate firm performance
Main goal: find out if economic value is equal to the market value (comparing opinions)
Three steps of equity valuation:
1. Understand the past
2. Forecasting the future
3. Valuation
Valuation:
NPV: net present value
Value: present value of the expected FCFs
Discounted Dividend Model (DDM): uses dividends as main parameter (rarely used)
Problems:
- Dividend is a choice, and does not reflect performance correctly.
→ E.g., paying out dividends, while still making losses.
- Dividends are discretionary (avoid cutting dividends in times of losses as this is a bad look)
- Many firms don’t even pay dividends
- Dividend irrelevance theorem
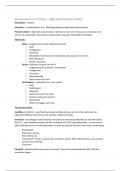
Earnings-based valuation:
Graphical representation:
3
, Mathematical representation:
(1) Price:
(2) Clean surplus relation: change in shareholders equity
→ = Common equity (CE) last period + Net income (NI) – dividends (DIV)
(3) Dividends:
(4) Plugging (3) into (1):
Note: past information (CE0) + future information (expected difference between realized
return on equity (NIt) minus expected rate of return (r * CEt-1))
Return on equity (ROE) = net income / common equity = NI / CE
Dirty surplus: some income items are not in the income statement but are directly in the
statement of changes in equity.
Valuation drivers:
1. Investment growth (g): hidden in the change of CE, which can grow or decrease.
- Profitability is not the only important thing
Example: 10% return on $100 is less impressive than 10% on $1.000.000
- Investments can be cyclical, regional & structural.
2. Risk (r): compare to risk-free rate to see if any value is created (realized return – Rf > 0)
- Discount rate (r) is measure of uncertainty as we don’t know expected values 100% sure.
→ Use asset pricing models to determine value of discount rate (r).
3. Profitability (ROE): return on equity
- Similar to the return on investments (ROI), but then for equity investors.
- Hence, ROE is the rate of return that equity owner receives.
→ ROE must be higher than the opportunity costs (r) in order to generate value.
→ ROE > r
Constant growth:
Assumptions:
1. Constant ROE
2. Capital grows by g each year
4
STATEMENT ANALYSIS
& VALUATION:
SUMMARY
@ECOsummaries
→ 20% discount
1
,Table of contents
Lecture 1_________________________________________________page 3-4
Practise session 1__________________________________________page 5-7
Lecture 2_________________________________________________page 8-12
Practise session 2__________________________________________page 13-15
Lecture 3_________________________________________________page 16-21
Practise session 3__________________________________________page 22-26
Lecture 4_________________________________________________page 27-30
Practise session 4__________________________________________page 31-35
Lecture 5_________________________________________________page 36-41
Practise session 5__________________________________________page 42-45
Lecture 6_________________________________________________page 36-50
Practise session 6__________________________________________page 51-53
Lecture 7_________________________________________________page 54-58
2
,Lecture 1 – Valuation drivers
Introduction:
Firm value: discounted sum of expected future cash flows (economic value)
Financial statements are not used to derive a single true/false equity value
→ Does not exist!
Accounting: language to measure and communicate firm performance
Main goal: find out if economic value is equal to the market value (comparing opinions)
Three steps of equity valuation:
1. Understand the past
2. Forecasting the future
3. Valuation
Valuation:
NPV: net present value
Value: present value of the expected FCFs
Discounted Dividend Model (DDM): uses dividends as main parameter (rarely used)
Problems:
- Dividend is a choice, and does not reflect performance correctly.
→ E.g., paying out dividends, while still making losses.
- Dividends are discretionary (avoid cutting dividends in times of losses as this is a bad look)
- Many firms don’t even pay dividends
- Dividend irrelevance theorem
Earnings-based valuation:
Graphical representation:
3
, Mathematical representation:
(1) Price:
(2) Clean surplus relation: change in shareholders equity
→ = Common equity (CE) last period + Net income (NI) – dividends (DIV)
(3) Dividends:
(4) Plugging (3) into (1):
Note: past information (CE0) + future information (expected difference between realized
return on equity (NIt) minus expected rate of return (r * CEt-1))
Return on equity (ROE) = net income / common equity = NI / CE
Dirty surplus: some income items are not in the income statement but are directly in the
statement of changes in equity.
Valuation drivers:
1. Investment growth (g): hidden in the change of CE, which can grow or decrease.
- Profitability is not the only important thing
Example: 10% return on $100 is less impressive than 10% on $1.000.000
- Investments can be cyclical, regional & structural.
2. Risk (r): compare to risk-free rate to see if any value is created (realized return – Rf > 0)
- Discount rate (r) is measure of uncertainty as we don’t know expected values 100% sure.
→ Use asset pricing models to determine value of discount rate (r).
3. Profitability (ROE): return on equity
- Similar to the return on investments (ROI), but then for equity investors.
- Hence, ROE is the rate of return that equity owner receives.
→ ROE must be higher than the opportunity costs (r) in order to generate value.
→ ROE > r
Constant growth:
Assumptions:
1. Constant ROE
2. Capital grows by g each year
4