3.3 – Decision Making Techniques
3.3.1 – Quantitative Sales Forecasting
Quantitative sales Numerical techniques used to predict future sales volumes and
forecastinng values
Time-series analysis A quantiifable technique that shows past sales ifngures in date
order to help inform sales forecastinng
Movinng averanges A quantitative sales forecastinng technique which shows whether
a trend is singniifcant by smoothinng out fuctuations in data
Scatter ngraphs A quantiifable technique that plots the relationship between two
variables to identify correlation in order to inform sales
forecastinng
Extrapolation Usinng past data to extend an identiifed trend into the future
Variation Actual data – trend data
Averange cyclical Total of all cyclical V’s for a quarter
variation Number of results for that quarter
Why Use Sales Forecastinngg
Helpful when predictinng cash fow
Good for planninng and ornganisinng e.ng. stock
Helps with HR planninng e.ng. stafnng
Can be used to set tarngets
Helpful for planninng marketinng campaingns
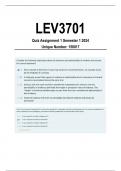
3-Point Movinng Averanges
1. Collate raw sales data in time order (time series data)
2. Smooth out raw data usinng movinng averanges
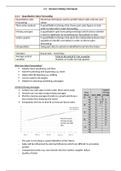
3. Plot the movinng averanges (trend) on a ngraph and draw a
line of best ift to illustrate the trend
4. Extrapolate the line of best ift to forecast future sales
Plot the 3 point
movinng averange,
not the raw sales
data
The past is not always a ngood indication of the future
Sales will be infuenced by external infuences which are difcult to accurately
predict
Unexpected events e.ng. new entrant into the market, supplier failure
Quality of datag
3.3.1 – Quantitative Sales Forecasting
Quantitative sales Numerical techniques used to predict future sales volumes and
forecastinng values
Time-series analysis A quantiifable technique that shows past sales ifngures in date
order to help inform sales forecastinng
Movinng averanges A quantitative sales forecastinng technique which shows whether
a trend is singniifcant by smoothinng out fuctuations in data
Scatter ngraphs A quantiifable technique that plots the relationship between two
variables to identify correlation in order to inform sales
forecastinng
Extrapolation Usinng past data to extend an identiifed trend into the future
Variation Actual data – trend data
Averange cyclical Total of all cyclical V’s for a quarter
variation Number of results for that quarter
Why Use Sales Forecastinngg
Helpful when predictinng cash fow
Good for planninng and ornganisinng e.ng. stock
Helps with HR planninng e.ng. stafnng
Can be used to set tarngets
Helpful for planninng marketinng campaingns
3-Point Movinng Averanges
1. Collate raw sales data in time order (time series data)
2. Smooth out raw data usinng movinng averanges
3. Plot the movinng averanges (trend) on a ngraph and draw a
line of best ift to illustrate the trend
4. Extrapolate the line of best ift to forecast future sales
Plot the 3 point
movinng averange,
not the raw sales
data
The past is not always a ngood indication of the future
Sales will be infuenced by external infuences which are difcult to accurately
predict
Unexpected events e.ng. new entrant into the market, supplier failure
Quality of datag