Worked Examples Theory
Worked Example 1 – Chapter 3
Confidence Interval for Standardized Scores
We can find the CI without SPSS or the formula
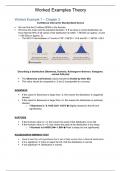
We know the mean and the standard deviation If we draw a normal distribution we
know that the 95% of all values of the distribution lie within -1.96 SDs (or approx. 2) and
+1.96 SDs (or approx. 2).
o The 95% CI lies between a T-score of “50”-1.96*20 = 10.8 and 50 + 1.96*20 = 89.2
Describing a distribution (Skewness, Kurtosis, Kolmogorov-Smirnov, histogram,
normal Q-Q plot)
The Skewness and Kurtosis values should be divided by their SEs
This value should be compared to -2 and 2 (comparable to z-scores).
SKEWNESS
If the value for Skewness is larger than -2, this means the distribution is negatively
skewed
If the value for Skewness is larger than +2, this means the distribution is positively
skewed
o If Skewness is -0.119/0.122= -0.975 Slightly skewed to the left (not
significantly)
KURTOSIS
If the Kurtosis value is >-2, this means the peak of the distribution is too flat
If the Kurtosis value is >+2, this means the peak of the distribution is too sharp
o If Kurtosis is 0.456/0.244= 1.869 Peak is sharp but not significantly
KOLMOGOROV-SMIRNOV TEST
Used to test the null hypothesis that a set of data comes from a Normal distribution.
If it is significant Have to reject the H0, that the distribution is normal
If not significant Distribution is normal
, Worked Examples Theory
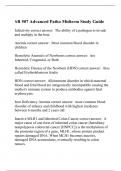
You’re looking for a T-score corresponding to a “4.0” but you have “3.9” and “4.2”.
We look at 3.9 and 4.2 T-scores 31 and 34 respectively.
o A 0.3 grade points difference corresponds to a difference of 3 T-score points
4.0 then is 31+1 since the difference between 3.9 and 4.0 is 0.1 grade points
Differences between percentile ranks and p-values stemming from a standard ND?
Both percentile ranks and p-values show the % of people with an equal or lower score.
What we use depends on whether or not the population is normally distributed
o If we have a normally distributed population P-value is preferred because it is
less influenced by sample fluctuations
o If the population is not normally distributed Percentile ranks are better to use
Interpreting percentile ranks and p-values
Let’s say the percentile rank for a grade of 3.9 = 18.34 and p-value is .17
Percentile rank: 18.34% of the students had a grade of 3.9 or lower
P-value: 17% of the students had a grade of 3.9 or lower
**What do these values tell us about the distribution of the grades?
we can compare these percentages to see whether they differ a lot
If the do, then we can say that the distribution is not normal (but we should do this with
multiple values before drawing this conclusion)
When should we use p-values from the standard normal distribution and when not?
When we can safely assume that the distribution of the scores is truly normal,
then we can use p-value
If we suspect that the distribution is not normal in the population we shouldn’t use
p-values
o Might lead to a percentage that differs too much from the appropriate
percentage not assuming a normal distribution of the scores
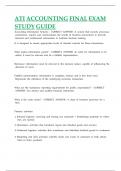
You’re looking for a normalized score corresponding to a “4.0” but you have “3.9”
and “4.2”
T-norm score for 3.9 = 32 and for 4.2 = 35
There is a 0.3 grade points difference corresponding to 3 T-norm score points
So T-norm for 4.0 = 33 (0.1 grade point = 1 T-norm score point)
, Worked Examples Theory
Difference between T-scores and T-norm scores
T-SCORES
T-scores were not normalized, they were only standardized
Because they are a transformation of Z-scores which are standardized scores, but not norm.
T-scores are a linear transformation of the Z-scores, the shape of the distribution of the T-scores
will remain the same as the distribution of the raw scores (thus not necessarily normal!).
T-NORM SCORES
The T-norm scores, however, were both standardized and normalized.
T-norm scores are a transformation of the normalized scores
T-norm scores are transformed in a way that the shape of the distribution of the scores more
closely approximates a normal distribution than in its original shape (non-linear transformation)
SPSS Skills WE1
Calculate the Z-scores and the T-scores. Make sure the T-scores are rounded.
• Use Analyze->Descriptive Statistics->Descriptives and select save standardized variables to
calculate Z-scores.
• Use Transform -> Compute to calculate variable T. Use the function RND to round the
variable: T = RND(20 × Znr_cor + 50).
Calculate the 95% interval of the scores using percentile ranks
• Use Analyze>-Descriptive Statistics->Explore, Put T-score in the dependent list.
• Then: Statistics->Percentiles->Paste
• In the syntax, change: /PERCENTILES(5,10,25,50,75,90,95) HAVERAGE into
/PERCENTILES(2.5, 97.5) HAVERAGE to get the lowest and highest 2.5% percentiles
The answer differs from before because previously we assumed a normal distribution, but
now we don’t because we use percentiles.
Calculate p-values stemming from the standard normal distribution and percentile ranks
• To calculate the p-values use Transform -> Compute to calculate percentile ranks using the
standard normal distribution. Use the function CDF.NORMAL(Znr_cor,0,1).
• To calculate the percentiles use Transform -> Rank Cases – Variables: nr_cor. Use the rank
types to select Fractional Rank as %
Worked Example 1 – Chapter 3
Confidence Interval for Standardized Scores
We can find the CI without SPSS or the formula
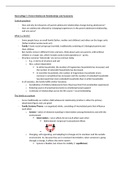
We know the mean and the standard deviation If we draw a normal distribution we
know that the 95% of all values of the distribution lie within -1.96 SDs (or approx. 2) and
+1.96 SDs (or approx. 2).
o The 95% CI lies between a T-score of “50”-1.96*20 = 10.8 and 50 + 1.96*20 = 89.2
Describing a distribution (Skewness, Kurtosis, Kolmogorov-Smirnov, histogram,
normal Q-Q plot)
The Skewness and Kurtosis values should be divided by their SEs
This value should be compared to -2 and 2 (comparable to z-scores).
SKEWNESS
If the value for Skewness is larger than -2, this means the distribution is negatively
skewed
If the value for Skewness is larger than +2, this means the distribution is positively
skewed
o If Skewness is -0.119/0.122= -0.975 Slightly skewed to the left (not
significantly)
KURTOSIS
If the Kurtosis value is >-2, this means the peak of the distribution is too flat
If the Kurtosis value is >+2, this means the peak of the distribution is too sharp
o If Kurtosis is 0.456/0.244= 1.869 Peak is sharp but not significantly
KOLMOGOROV-SMIRNOV TEST
Used to test the null hypothesis that a set of data comes from a Normal distribution.
If it is significant Have to reject the H0, that the distribution is normal
If not significant Distribution is normal
, Worked Examples Theory
You’re looking for a T-score corresponding to a “4.0” but you have “3.9” and “4.2”.
We look at 3.9 and 4.2 T-scores 31 and 34 respectively.
o A 0.3 grade points difference corresponds to a difference of 3 T-score points
4.0 then is 31+1 since the difference between 3.9 and 4.0 is 0.1 grade points
Differences between percentile ranks and p-values stemming from a standard ND?
Both percentile ranks and p-values show the % of people with an equal or lower score.
What we use depends on whether or not the population is normally distributed
o If we have a normally distributed population P-value is preferred because it is
less influenced by sample fluctuations
o If the population is not normally distributed Percentile ranks are better to use
Interpreting percentile ranks and p-values
Let’s say the percentile rank for a grade of 3.9 = 18.34 and p-value is .17
Percentile rank: 18.34% of the students had a grade of 3.9 or lower
P-value: 17% of the students had a grade of 3.9 or lower
**What do these values tell us about the distribution of the grades?
we can compare these percentages to see whether they differ a lot
If the do, then we can say that the distribution is not normal (but we should do this with
multiple values before drawing this conclusion)
When should we use p-values from the standard normal distribution and when not?
When we can safely assume that the distribution of the scores is truly normal,
then we can use p-value
If we suspect that the distribution is not normal in the population we shouldn’t use
p-values
o Might lead to a percentage that differs too much from the appropriate
percentage not assuming a normal distribution of the scores
You’re looking for a normalized score corresponding to a “4.0” but you have “3.9”
and “4.2”
T-norm score for 3.9 = 32 and for 4.2 = 35
There is a 0.3 grade points difference corresponding to 3 T-norm score points
So T-norm for 4.0 = 33 (0.1 grade point = 1 T-norm score point)
, Worked Examples Theory
Difference between T-scores and T-norm scores
T-SCORES
T-scores were not normalized, they were only standardized
Because they are a transformation of Z-scores which are standardized scores, but not norm.
T-scores are a linear transformation of the Z-scores, the shape of the distribution of the T-scores
will remain the same as the distribution of the raw scores (thus not necessarily normal!).
T-NORM SCORES
The T-norm scores, however, were both standardized and normalized.
T-norm scores are a transformation of the normalized scores
T-norm scores are transformed in a way that the shape of the distribution of the scores more
closely approximates a normal distribution than in its original shape (non-linear transformation)
SPSS Skills WE1
Calculate the Z-scores and the T-scores. Make sure the T-scores are rounded.
• Use Analyze->Descriptive Statistics->Descriptives and select save standardized variables to
calculate Z-scores.
• Use Transform -> Compute to calculate variable T. Use the function RND to round the
variable: T = RND(20 × Znr_cor + 50).
Calculate the 95% interval of the scores using percentile ranks
• Use Analyze>-Descriptive Statistics->Explore, Put T-score in the dependent list.
• Then: Statistics->Percentiles->Paste
• In the syntax, change: /PERCENTILES(5,10,25,50,75,90,95) HAVERAGE into
/PERCENTILES(2.5, 97.5) HAVERAGE to get the lowest and highest 2.5% percentiles
The answer differs from before because previously we assumed a normal distribution, but
now we don’t because we use percentiles.
Calculate p-values stemming from the standard normal distribution and percentile ranks
• To calculate the p-values use Transform -> Compute to calculate percentile ranks using the
standard normal distribution. Use the function CDF.NORMAL(Znr_cor,0,1).
• To calculate the percentiles use Transform -> Rank Cases – Variables: nr_cor. Use the rank
types to select Fractional Rank as %