Inhoud
Lecture 1 Multiple Linear Regression (MLR) ........................................................................................... 3
Lecture 2 Analysis of Variance (ANOVA) .................................................................................................. 8
Lecture 3 Analysis of Covariance (ANCOVA) .......................................................................................... 11
Lecture 4 Repeated Measures ANOVA (RMA) ....................................................................................... 13
Lecture 5 Mediation analysis ................................................................................................................. 16
Rehearsal of everything ......................................................................................................................... 18
All assumptions ................................................................................................................................. 19
Seminar 1 Preregistration and Open Science ........................................................................................ 21
Seminar 2 Open Data Analyses.............................................................................................................. 24
Seminar 3 Software choices & Informative hypotheses........................................................................ 25
Seminar 4 Solutions to assumptions violations including bootstrap .................................................... 27
Grasple lessons ...................................................................................................................................... 29
Refresh part 1 ........................................................................................................................................ 29
Refresh part 2 ........................................................................................................................................ 30
Refresh part 3 ........................................................................................................................................ 31
Week 1 Bayes and MLR ......................................................................................................................... 33
The Bayesian approach...................................................................................................................... 33
Assumptions 1 ................................................................................................................................... 34
Assumptions 2 ................................................................................................................................... 35
Multiple Linear Regression, including hierarchical MLR.................................................................... 37
Creating dummy variables ................................................................................................................. 38
Multiple regression with dummy variables (interpretation) ............................................................. 39
Week 2 Factorial ANOVA Factorial ANOVA: visually assessing main and interaction effects ................ 40
ANOVA assumptions .......................................................................................................................... 41
Factorial ANOVA ................................................................................................................................ 41
About multiple testing and error rates .............................................................................................. 41
Follow-up testing (frequentist) .......................................................................................................... 42
Informative hypotheses (Bayes) ........................................................................................................ 44
Week 3 ANCOVA .................................................................................................................................... 45
Averages and corrected averages ...................................................................................................... 45
ANCOVA (frequentist) ........................................................................................................................ 48
FAIR .................................................................................................................................................... 49
ANCOVA as regression ....................................................................................................................... 49
ANCOVA (Bayesian) ........................................................................................................................... 50
, Supporting the null hypothesis ......................................................................................................... 50
Week 4 Repeated measures ANOVA ..................................................................................................... 51
Within factors and between factors .................................................................................................. 51
The sphericity assumption ................................................................................................................ 51
Mixed design RMA (repeated measures ANOVA) ............................................................................. 52
Week 5 Mediation analysis.................................................................................................................... 53
Moderation vs. mediation ................................................................................................................. 53
Bootstrapping .................................................................................................................................... 54
Mediation analysis............................................................................................................................. 54
Workgroup 1 .......................................................................................................................................... 56
Workgroup 2 .......................................................................................................................................... 56
Workgroup 3 .......................................................................................................................................... 57
Workgroup 4 .......................................................................................................................................... 58
Workgroup 5 .......................................................................................................................................... 58
,Lecture 1 Multiple Linear Regression (MLR)
Frequentist framework = tests how well the data fits the null hypothesis (NHST)
- P-values
- Confidence intervals (=if we were to repeat this experiment many times and calculate
a CI each time, 95% of the intervals will include the true parameter value, and 5%
won’t)
- Effect sizes
- Power analysis
Bayesian framework = probability of the hypothesis given the data, taking prior information
into account
- Bayes factor (BFs)
- Priors (expectation beforehand)
- Posteriors (=prior and data)
- Credible intervals (=there is 95% probability that the true values is in the interval)
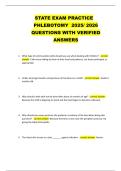
Empirical research = uses collected data to learn from, information is captured in a likelihood
function. →frequentist
X-axis: values for population mean
→for example height: 140 and 230 cm height for an adult are less likely than 165 cm for an
adult.
Y-axis: probability of the observed data for each value of population mean (µ)
Bayesian approach = prior knowledge is updated with information in the data and together
provides the posterior distribution for µ
- Advantage = accumulating knowledge (today’s posterior is tomorrow’s prior)
- Disadvantage = results depend on choice of prior
The posterior distribution of the parameters of interest provides all desired estimates:
- Posterior mean or mode
- Posterior SD (comparable to frequentist standard error)
- Posterior 95% credible interval (providing the bounds of the part of the posterior in
which 95% of the posterior mass is)
Results depend on things not observed and on the sampling plan (how you test).
Bayesian probability = probability that hypothesis Hj is supported by the data.
→Pr(Hj|data)
Frequentist probability = probability of observing same or more extreme data given that the
null hypothesis is true (p-values).
→Pr(data|H0)
PMP = Posterior Model Probability; the (Bayesian) probability of the hypothesis after
observing the data
→are also relative probabilities
, →PMPs are updates of prior probabilities for hypotheses with the BF
Bayesian probability of a hypothesis being true depends on two criteria:
- The prior = how sensible it is, based on prior knowledge
- The data = how well it fits the new evidence
Bayesian testing is comparative: hypotheses are tested against one another
Bayes Factor (BF) = 10 → support for H1 is 10 times stronger than for H0
Bayes Factor (BF) = 1 → support for H1 is as strong as support for H0
Both frameworks use probability theory, but:
- Frequentist: probability is the relative frequency of events
→more formal
- Bayesian: probability is the degree of belief
→more intuitive
→this leads to debate (=same word is used for different things)
→and leads to differences in the correct interpretation of statistical results (like confidence
and credible interval)
Multiple linear regression (MLR)
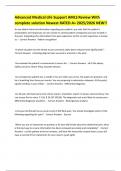
‘normal’ linear regression:
^Y = B0 + B1 x X
^Y = intercept + slobe x X-value
→so we use X to predict Y
Residual = distance from the line = e
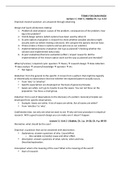
Multiple linear regression = with more predictors (Y = observed, Y^ = predicted)
Y = B0 + B1 x X + B2 x X + e
Y = intercept + slobe 1 x X-value + slobe 2 x X-value + residual
→Life satisfaction decreases by age, but increases by years of education
Lecture 1 Multiple Linear Regression (MLR) ........................................................................................... 3
Lecture 2 Analysis of Variance (ANOVA) .................................................................................................. 8
Lecture 3 Analysis of Covariance (ANCOVA) .......................................................................................... 11
Lecture 4 Repeated Measures ANOVA (RMA) ....................................................................................... 13
Lecture 5 Mediation analysis ................................................................................................................. 16
Rehearsal of everything ......................................................................................................................... 18
All assumptions ................................................................................................................................. 19
Seminar 1 Preregistration and Open Science ........................................................................................ 21
Seminar 2 Open Data Analyses.............................................................................................................. 24
Seminar 3 Software choices & Informative hypotheses........................................................................ 25
Seminar 4 Solutions to assumptions violations including bootstrap .................................................... 27
Grasple lessons ...................................................................................................................................... 29
Refresh part 1 ........................................................................................................................................ 29
Refresh part 2 ........................................................................................................................................ 30
Refresh part 3 ........................................................................................................................................ 31
Week 1 Bayes and MLR ......................................................................................................................... 33
The Bayesian approach...................................................................................................................... 33
Assumptions 1 ................................................................................................................................... 34
Assumptions 2 ................................................................................................................................... 35
Multiple Linear Regression, including hierarchical MLR.................................................................... 37
Creating dummy variables ................................................................................................................. 38
Multiple regression with dummy variables (interpretation) ............................................................. 39
Week 2 Factorial ANOVA Factorial ANOVA: visually assessing main and interaction effects ................ 40
ANOVA assumptions .......................................................................................................................... 41
Factorial ANOVA ................................................................................................................................ 41
About multiple testing and error rates .............................................................................................. 41
Follow-up testing (frequentist) .......................................................................................................... 42
Informative hypotheses (Bayes) ........................................................................................................ 44
Week 3 ANCOVA .................................................................................................................................... 45
Averages and corrected averages ...................................................................................................... 45
ANCOVA (frequentist) ........................................................................................................................ 48
FAIR .................................................................................................................................................... 49
ANCOVA as regression ....................................................................................................................... 49
ANCOVA (Bayesian) ........................................................................................................................... 50
, Supporting the null hypothesis ......................................................................................................... 50
Week 4 Repeated measures ANOVA ..................................................................................................... 51
Within factors and between factors .................................................................................................. 51
The sphericity assumption ................................................................................................................ 51
Mixed design RMA (repeated measures ANOVA) ............................................................................. 52
Week 5 Mediation analysis.................................................................................................................... 53
Moderation vs. mediation ................................................................................................................. 53
Bootstrapping .................................................................................................................................... 54
Mediation analysis............................................................................................................................. 54
Workgroup 1 .......................................................................................................................................... 56
Workgroup 2 .......................................................................................................................................... 56
Workgroup 3 .......................................................................................................................................... 57
Workgroup 4 .......................................................................................................................................... 58
Workgroup 5 .......................................................................................................................................... 58
,Lecture 1 Multiple Linear Regression (MLR)
Frequentist framework = tests how well the data fits the null hypothesis (NHST)
- P-values
- Confidence intervals (=if we were to repeat this experiment many times and calculate
a CI each time, 95% of the intervals will include the true parameter value, and 5%
won’t)
- Effect sizes
- Power analysis
Bayesian framework = probability of the hypothesis given the data, taking prior information
into account
- Bayes factor (BFs)
- Priors (expectation beforehand)
- Posteriors (=prior and data)
- Credible intervals (=there is 95% probability that the true values is in the interval)
Empirical research = uses collected data to learn from, information is captured in a likelihood
function. →frequentist
X-axis: values for population mean
→for example height: 140 and 230 cm height for an adult are less likely than 165 cm for an
adult.
Y-axis: probability of the observed data for each value of population mean (µ)
Bayesian approach = prior knowledge is updated with information in the data and together
provides the posterior distribution for µ
- Advantage = accumulating knowledge (today’s posterior is tomorrow’s prior)
- Disadvantage = results depend on choice of prior
The posterior distribution of the parameters of interest provides all desired estimates:
- Posterior mean or mode
- Posterior SD (comparable to frequentist standard error)
- Posterior 95% credible interval (providing the bounds of the part of the posterior in
which 95% of the posterior mass is)
Results depend on things not observed and on the sampling plan (how you test).
Bayesian probability = probability that hypothesis Hj is supported by the data.
→Pr(Hj|data)
Frequentist probability = probability of observing same or more extreme data given that the
null hypothesis is true (p-values).
→Pr(data|H0)
PMP = Posterior Model Probability; the (Bayesian) probability of the hypothesis after
observing the data
→are also relative probabilities
, →PMPs are updates of prior probabilities for hypotheses with the BF
Bayesian probability of a hypothesis being true depends on two criteria:
- The prior = how sensible it is, based on prior knowledge
- The data = how well it fits the new evidence
Bayesian testing is comparative: hypotheses are tested against one another
Bayes Factor (BF) = 10 → support for H1 is 10 times stronger than for H0
Bayes Factor (BF) = 1 → support for H1 is as strong as support for H0
Both frameworks use probability theory, but:
- Frequentist: probability is the relative frequency of events
→more formal
- Bayesian: probability is the degree of belief
→more intuitive
→this leads to debate (=same word is used for different things)
→and leads to differences in the correct interpretation of statistical results (like confidence
and credible interval)
Multiple linear regression (MLR)
‘normal’ linear regression:
^Y = B0 + B1 x X
^Y = intercept + slobe x X-value
→so we use X to predict Y
Residual = distance from the line = e
Multiple linear regression = with more predictors (Y = observed, Y^ = predicted)
Y = B0 + B1 x X + B2 x X + e
Y = intercept + slobe 1 x X-value + slobe 2 x X-value + residual
→Life satisfaction decreases by age, but increases by years of education