MATH 534 FINAL EXAM REVISION GUIDE QUESTIONS & ANSWERS
GRADED A+.
WARM-UP
Each number below represents the age of a U.S. president on his first inauguration.
57 61 57 57 58 57 61 54 68 51 49
50 48 65 52 56 46 54 49 50 47 55
54 42 51 56 55 51 54 51 60 62 43
56 61 52 69 64 64 55 55 47 54 47
A) Make a stem-and-leaf plot of these ages.
B) Make a histogram of the ages of U.S. presidents on their first
inauguration using 6 classes. Make sure each class is equal in size.
MATH 534 FINAL EXAM REVISION GUIDE
AL EXAM REVISION GUIDE
,MATH 534 FINAL EXAM REVISION GUIDE QUESTIONS & ANSWERS
GRADED A+.
C) What was the mean age of the presidents on their first inauguration?
D) Which age(s) occur most frequently?
E) What is the median age?
F) Are there any outliers to the data?
MATH 534 FINAL EXAM REVISION GUIDE
AL EXAM REVISION GUIDE
,MATH 534 FINAL EXAM REVISION GUIDE QUESTIONS & ANSWERS
GRADED A+.
15.1 The Frequency Distribution
1. Frequency: how many times something occurs
2. Frequency Distribution: A set of data listed with their frequencies (usually listed with categories or class intervals)
3. Relative Frequency Distribution:
A set of data listed with their percentages (usually listed with categories or class intervals)
4. Box-and-whisker Plot: A diagram that graphically displays the median, quartiles, extreme values, and outliers in a
set of data.Whiskers extend to the extreme values of the data, unless there is an outlier When there is an outlier, then
it is the extreme value.
5. Outliers: Extreme values that are more than 1.5 of the interquartile range beyond the upper or lower quartiles.
If outliers exist, each whisker is extended to the last value of the data that is not an outlier.
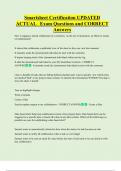
6. Use the following box plot of student test scores on last year’s advanced algebra mid-year exam.
a. What is the median score?
b. What is the interquartile range?
MATH 534 FINAL EXAM REVISION GUIDE
AL EXAM REVISION GUIDE
, MATH 534 FINAL EXAM REVISION GUIDE QUESTIONS & ANSWERS
GRADED A+.
c. What percent of the students scored between 62 and 91?
MATH 534 FINAL EXAM REVISION GUIDE
AL EXAM REVISION GUIDE
GRADED A+.
WARM-UP
Each number below represents the age of a U.S. president on his first inauguration.
57 61 57 57 58 57 61 54 68 51 49
50 48 65 52 56 46 54 49 50 47 55
54 42 51 56 55 51 54 51 60 62 43
56 61 52 69 64 64 55 55 47 54 47
A) Make a stem-and-leaf plot of these ages.
B) Make a histogram of the ages of U.S. presidents on their first
inauguration using 6 classes. Make sure each class is equal in size.
MATH 534 FINAL EXAM REVISION GUIDE
AL EXAM REVISION GUIDE
,MATH 534 FINAL EXAM REVISION GUIDE QUESTIONS & ANSWERS
GRADED A+.
C) What was the mean age of the presidents on their first inauguration?
D) Which age(s) occur most frequently?
E) What is the median age?
F) Are there any outliers to the data?
MATH 534 FINAL EXAM REVISION GUIDE
AL EXAM REVISION GUIDE
,MATH 534 FINAL EXAM REVISION GUIDE QUESTIONS & ANSWERS
GRADED A+.
15.1 The Frequency Distribution
1. Frequency: how many times something occurs
2. Frequency Distribution: A set of data listed with their frequencies (usually listed with categories or class intervals)
3. Relative Frequency Distribution:
A set of data listed with their percentages (usually listed with categories or class intervals)
4. Box-and-whisker Plot: A diagram that graphically displays the median, quartiles, extreme values, and outliers in a
set of data.Whiskers extend to the extreme values of the data, unless there is an outlier When there is an outlier, then
it is the extreme value.
5. Outliers: Extreme values that are more than 1.5 of the interquartile range beyond the upper or lower quartiles.
If outliers exist, each whisker is extended to the last value of the data that is not an outlier.
6. Use the following box plot of student test scores on last year’s advanced algebra mid-year exam.
a. What is the median score?
b. What is the interquartile range?
MATH 534 FINAL EXAM REVISION GUIDE
AL EXAM REVISION GUIDE
, MATH 534 FINAL EXAM REVISION GUIDE QUESTIONS & ANSWERS
GRADED A+.
c. What percent of the students scored between 62 and 91?
MATH 534 FINAL EXAM REVISION GUIDE
AL EXAM REVISION GUIDE