TUTTI )IYf¥P0P4IaII0N
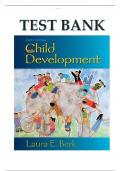
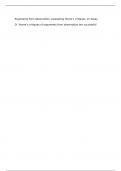
Population -_ an open system
mr nr r r r nnr r r r r r r r r r r r r
BIRTHS -_
immigrants
DEATHS -_
em migrants
For global population tot birth must > deaths
BIRTHS IMMIGRANTS
t t
t t
NATURAL MIGRATION
CHANGE CHANGE
-
-
t t
DEATHS EMMI GRANTS
BIRTHRATE → no - of live births per thousand of thepopulation per year
Death 1297 @ → no ,
of death per thousand of the population per year
Natural Increase → when birthrate is above death rate
Natural Dea crease → when death rate is above birthrate
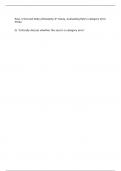
decline in
death rates t development of
infant mortality
immigration
n modern medicine
rates T ) n
sanitation :
cleaner WHY Does
) pronator list policy
water 1- better ← POPULATION → modern agriculture
sewage disposal Increase ?
secures plentiful food
y j
supply 1- better diets
better healthcare intro of
services vaccination
immunisation
programmes
spread of disease t
lack medical facilities t
cures
f death rate > birthrate
anti natalia
-
WHY Does 1
policy ← POPULATION → natural disasters
Decrease ?
↳
I food shortages
war and conflict -
↳
em migration
men away -
not
many babies -
lives
lost
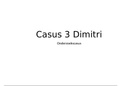
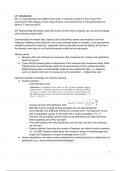
, DEMOGRAPHIC TRANSITION MODEL ( DTM )
Fthatvhowhowbirthateaeathrateahdtotapopulationsiz.ec hanger
w/ development level Ofa country
* KEY POINT : it expects birth and death rates to be diff in LEDCS and MEDCS
-
DEMOGRCLIHIC > concerned w/ population
TRANSITION -7 change overtime
IOIAIEERTIIIIYRgthe-theavno.lt children that a women will have over the course
of their lifetime
STD Get STdGe2 STdGe3 STAGE 4 STAGES
-
Birthrate
-
w/
eathrate
#¢
Xx
E Total Population
* doesn't take
one
no
So
migration & gov .
1-
policy into acc .
NOO
•
• I
⇐⇐
±
÷
TIME
BRP lack of birth
:
BRP : "
BRI :
fewerchildr.BR/v:birthcon,pplBRd : "
( Oh , WOMEN MANY needed , more choose Children
no .of RT slightly , elderly
improved med
:
Dpj :
,
en
birth con ,t infant population
YOUNG clean water ,
sanitati - .
DRI : 11
improved deaths , women
↳ depend of
migration
DRT : disease , famine on ,
more +
marry later
ylitttelhonatyralin
t
,
food pattern
lack of clean water
medical care ↳ Tnaturalin -
Dpj : "
S2
↳ some buts
↳ lvhaturalih .
causes OIEAIIINGBR
① CONTRACEPTION
-
MEDC :
educated , affordable
-
LEDC culture
:
② LOW FERTILITY RATE
-
lvinfant mortality rate
③ ANTI Na -19115T POLICY
-
④ GENDER EQUALITY
-
woman postpone starting tamctocusonedl work )
⑤ CHILDREN are expensive
-
$200,000 to 18 yr old
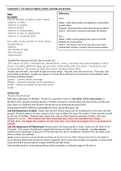
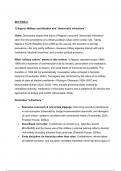
,POPULATION PYRAMID
↳ show population structure Ofa country
* can highlight possible issues in country 's pop.eg gender imbalance -
* changes ascountrydev .
TULLER : longer life
expectancy
ELDERLY DEPENDANTS -3120daL :P prop .
765 of ppl living longer
Iff between
ECONOMICALLY mendgwomolh
ACTIVE
INDENTS :PDR
YOUNG DEPENDANTS BUIGES immigration /
:
baby boom
< 15
Base :X to birthrate
DEFENDANT 101419110N → depend on economically active for support } resources
ECONOMIC 9IIY ACTIVE → working population , aged 15-64
POPULATION STRUCTURE → breakdown otageandgenderofq population
RAPID POPULATION GROWTH
IRO NdI9IIoIICY -79 gov Policy that encourages ppl to have children ;PBR
-
.
ANTI NGIQIIOIT.ci/ → a gov policy that encourages ppl to have fewer children ;WBR
- -
DEPENDENCY RATIO -2 relationship between wnoareanclarenotinqnareq
↳ shows how many dependents too economically active people inacoyntrymustsnpport
DEPENDENCY Rq -110=11
-
Under 15 )tl%0ver65)
✗ goo
1. between 15-64
'
AGEING -120134101110N → population w/ a high proportion of elderly dependents, caused
by rising life expectancy and / ordeclining fertility rates
, I 0 I 4191 ION DIS I RI BUI ION & DENS II Y
90% live north of the Equator
10-1 live south of the Equator
.
50-1 live
. near the ocean
q Of live.
on 10% of the land
I 0174191 I ON DISTRIBUTION → how 9 population is spread out across a country
or an area
I 0174191 ION DENSITY → the no -
Of people living in a given area
,
usually per kmz
no .
Of ppl
PD ( ppl 1km2 ) =
, and are a CKMZ)
DENSELY I 0174191 ED → a large no Of people living in a small area
.
SPARSE I Y I 01? 4 I DIED → a small no of people living in a large area
.
OVER & UNDER POP 4 I 9 I ION
↳ terms that depend on the relationship between the population of an area and
resources available
* lots of ppl =/
overpopulated
OVER I 0141911 ON → when there is not enough resources ( must define types
for the inhabitant in an area
I ROB I ems
0 UN employment
o shortage of social services, houses
of informal settlements
of price, T demand for house, food , energy etc
of pollution
o
pressure on natural resources
4N De RIO I 4.191 ION → when there are more resources than inhabitants in an area
I ROB I ems
o
surplus in food and water → waste
o societal systems will not have
enough demand
o less econ active → P in taxation
.
o P standards of livings
Population -_ an open system
mr nr r r r nnr r r r r r r r r r r r r
BIRTHS -_
immigrants
DEATHS -_
em migrants
For global population tot birth must > deaths
BIRTHS IMMIGRANTS
t t
t t
NATURAL MIGRATION
CHANGE CHANGE
-
-
t t
DEATHS EMMI GRANTS
BIRTHRATE → no - of live births per thousand of thepopulation per year
Death 1297 @ → no ,
of death per thousand of the population per year
Natural Increase → when birthrate is above death rate
Natural Dea crease → when death rate is above birthrate
decline in
death rates t development of
infant mortality
immigration
n modern medicine
rates T ) n
sanitation :
cleaner WHY Does
) pronator list policy
water 1- better ← POPULATION → modern agriculture
sewage disposal Increase ?
secures plentiful food
y j
supply 1- better diets
better healthcare intro of
services vaccination
immunisation
programmes
spread of disease t
lack medical facilities t
cures
f death rate > birthrate
anti natalia
-
WHY Does 1
policy ← POPULATION → natural disasters
Decrease ?
↳
I food shortages
war and conflict -
↳
em migration
men away -
not
many babies -
lives
lost
, DEMOGRAPHIC TRANSITION MODEL ( DTM )
Fthatvhowhowbirthateaeathrateahdtotapopulationsiz.ec hanger
w/ development level Ofa country
* KEY POINT : it expects birth and death rates to be diff in LEDCS and MEDCS
-
DEMOGRCLIHIC > concerned w/ population
TRANSITION -7 change overtime
IOIAIEERTIIIIYRgthe-theavno.lt children that a women will have over the course
of their lifetime
STD Get STdGe2 STdGe3 STAGE 4 STAGES
-
Birthrate
-
w/
eathrate
#¢
Xx
E Total Population
* doesn't take
one
no
So
migration & gov .
1-
policy into acc .
NOO
•
• I
⇐⇐
±
÷
TIME
BRP lack of birth
:
BRP : "
BRI :
fewerchildr.BR/v:birthcon,pplBRd : "
( Oh , WOMEN MANY needed , more choose Children
no .of RT slightly , elderly
improved med
:
Dpj :
,
en
birth con ,t infant population
YOUNG clean water ,
sanitati - .
DRI : 11
improved deaths , women
↳ depend of
migration
DRT : disease , famine on ,
more +
marry later
ylitttelhonatyralin
t
,
food pattern
lack of clean water
medical care ↳ Tnaturalin -
Dpj : "
S2
↳ some buts
↳ lvhaturalih .
causes OIEAIIINGBR
① CONTRACEPTION
-
MEDC :
educated , affordable
-
LEDC culture
:
② LOW FERTILITY RATE
-
lvinfant mortality rate
③ ANTI Na -19115T POLICY
-
④ GENDER EQUALITY
-
woman postpone starting tamctocusonedl work )
⑤ CHILDREN are expensive
-
$200,000 to 18 yr old
,POPULATION PYRAMID
↳ show population structure Ofa country
* can highlight possible issues in country 's pop.eg gender imbalance -
* changes ascountrydev .
TULLER : longer life
expectancy
ELDERLY DEPENDANTS -3120daL :P prop .
765 of ppl living longer
Iff between
ECONOMICALLY mendgwomolh
ACTIVE
INDENTS :PDR
YOUNG DEPENDANTS BUIGES immigration /
:
baby boom
< 15
Base :X to birthrate
DEFENDANT 101419110N → depend on economically active for support } resources
ECONOMIC 9IIY ACTIVE → working population , aged 15-64
POPULATION STRUCTURE → breakdown otageandgenderofq population
RAPID POPULATION GROWTH
IRO NdI9IIoIICY -79 gov Policy that encourages ppl to have children ;PBR
-
.
ANTI NGIQIIOIT.ci/ → a gov policy that encourages ppl to have fewer children ;WBR
- -
DEPENDENCY RATIO -2 relationship between wnoareanclarenotinqnareq
↳ shows how many dependents too economically active people inacoyntrymustsnpport
DEPENDENCY Rq -110=11
-
Under 15 )tl%0ver65)
✗ goo
1. between 15-64
'
AGEING -120134101110N → population w/ a high proportion of elderly dependents, caused
by rising life expectancy and / ordeclining fertility rates
, I 0 I 4191 ION DIS I RI BUI ION & DENS II Y
90% live north of the Equator
10-1 live south of the Equator
.
50-1 live
. near the ocean
q Of live.
on 10% of the land
I 0174191 I ON DISTRIBUTION → how 9 population is spread out across a country
or an area
I 0174191 ION DENSITY → the no -
Of people living in a given area
,
usually per kmz
no .
Of ppl
PD ( ppl 1km2 ) =
, and are a CKMZ)
DENSELY I 0174191 ED → a large no Of people living in a small area
.
SPARSE I Y I 01? 4 I DIED → a small no of people living in a large area
.
OVER & UNDER POP 4 I 9 I ION
↳ terms that depend on the relationship between the population of an area and
resources available
* lots of ppl =/
overpopulated
OVER I 0141911 ON → when there is not enough resources ( must define types
for the inhabitant in an area
I ROB I ems
0 UN employment
o shortage of social services, houses
of informal settlements
of price, T demand for house, food , energy etc
of pollution
o
pressure on natural resources
4N De RIO I 4.191 ION → when there are more resources than inhabitants in an area
I ROB I ems
o
surplus in food and water → waste
o societal systems will not have
enough demand
o less econ active → P in taxation
.
o P standards of livings