Historical Methods – Quantitative analysis
Seminar 1
Reading: Making History count (7-16; 33-53)
Types of measurements
Vertical (rows) = Variables
Horizontal (columns) = cases/observations
Information in both vertical and horizontal = values
Cross sectional: one time frame in several different units (same point in time)
Time series: process and in time, a particular case (unit) in different points in time
Panel data set: cross sectional organized chronologically
Levels of measurement
Nominal/categorical/indicator variables: categories, cannot order quantitatively (names,
religion etc) – f.ex Gender between 1 and 0 (1= men, 0 = women)
Ordinal: we can order these, but cannot specify distance. F.ex occupations in stratification –
higher skilled; levels of education. (organization based on scale)
Interval: measurable, divisible. f.ex wages, age and prices. We know the distance between
them and can order them according.
Populations vs. samples
Inferential statistics – use of samples as subset of the underlying population we are going to
study, widely reflective of larger population (representative for population.)
, Frequency distribution
Breaking data by thresholds (dates, categorizations etc)
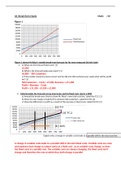
Measure of central tendency
- Mean – n+n = x x/n(n) = average
- Median – is the number where ½ date is below and ½ date above
- Mode – most common value in data set
Assignment 1
Use the Assignment 1 dataset (anthropometric data on body fat)
Task 1:
1. What level of measurement do the variables have?
The measurement of the variables are done at interval level. As the data are categorized and
arranged in equal interval between the categories.
2. Are these data ‘time series’ or ‘cross-section’, or ‘panel’?
These data is cross sectional, we know they are from different individual without any time
components.
Seminar 1
Reading: Making History count (7-16; 33-53)
Types of measurements
Vertical (rows) = Variables
Horizontal (columns) = cases/observations
Information in both vertical and horizontal = values
Cross sectional: one time frame in several different units (same point in time)
Time series: process and in time, a particular case (unit) in different points in time
Panel data set: cross sectional organized chronologically
Levels of measurement
Nominal/categorical/indicator variables: categories, cannot order quantitatively (names,
religion etc) – f.ex Gender between 1 and 0 (1= men, 0 = women)
Ordinal: we can order these, but cannot specify distance. F.ex occupations in stratification –
higher skilled; levels of education. (organization based on scale)
Interval: measurable, divisible. f.ex wages, age and prices. We know the distance between
them and can order them according.
Populations vs. samples
Inferential statistics – use of samples as subset of the underlying population we are going to
study, widely reflective of larger population (representative for population.)
, Frequency distribution
Breaking data by thresholds (dates, categorizations etc)
Measure of central tendency
- Mean – n+n = x x/n(n) = average
- Median – is the number where ½ date is below and ½ date above
- Mode – most common value in data set
Assignment 1
Use the Assignment 1 dataset (anthropometric data on body fat)
Task 1:
1. What level of measurement do the variables have?
The measurement of the variables are done at interval level. As the data are categorized and
arranged in equal interval between the categories.
2. Are these data ‘time series’ or ‘cross-section’, or ‘panel’?
These data is cross sectional, we know they are from different individual without any time
components.