Measuring the Vitamin C content in oranges, mandarins and tangerines
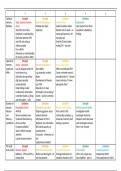
The table below shows the different standards and fruits used with the mean of each.
1 2 3 Mean
0.25g/250ml 28.3 27.5 28.0 28.0
0.30g 26.0 26.2 25.8 26.0
0.50g 29.2 27.6 28.4 28.4
1g 24.7 24.1 24.5 25.4
1.25g 17.5 17.4 17.2 17.4
1.50g 18.6 17.1 16.3 17.3
1.75g 8.0 8.5 8.7 8.4
Mandarin Juice 5.7 5.8 6.0 5.8
Tangerine Juice 6.7 6.6 6.7 6.7
Orange Juice 7.8 19.5 19.4 15.6
I have used standard deviation to measure the data spread from my results. There are two types of
standard deviation population and sample. Population standard deviation is the value calculate from
every individual in the population whereas sample deviation is a statistic which is calculated from
only certain individuals in the population. I used sample standard deviation because this would be
relevant to my data set because I have a sample with a much larger population. My standard
deviation was quite high with it being 17 for the 1 st set which means my data was quite spread out
which caused the deviation to be high. My deviation also indicates my data points are further away
from the mean. For my second set my standard deviation was low with it being 3 which was a good
result.
I used t-test for my practical to analyse my results. This is because I had 2 groups of means one being
the juices and the other being the standards this meant t-test is one of the only statistical test that is
used to compare two sets of means. Because the t-test is typically favoured over other tests when
the sample size is small, my t-test is suitable for my practical. This is because the t-test, which
considers sample size and delivers more trustworthy results than other tests that rely on bigger
sample sizes, which is more appropriate for my experiment.
, The graph below shows the mean of the juices against the standards